

Región y Desarrollo
Analisys of renewable energy potential in the Asia-Europe geographical axis
Análisis del potencial de las energías renovables en el eje geográfico Asia-Europa
Boletín Geográfico
Universidad Nacional del Comahue, Argentina
ISSN: 0326-1735
ISSN-e: 2313-903X
Periodicity: Semestral
vol. 45, 2023
Received: 07 June 2023
Accepted: 28 December 2023

Abstract: The limitation of conventional energy sources, on the one hand, and environmental concerns, on the other, have led countries increasingly to promote renewable energy technologies. Energy policy instruments play a crucial role in implementing innovation and reducing costs in renewable energy production. Countries deploy various policies to promote renewable energy technologies, such as capital subsidies, feed-in tariffs, tradable certificates, and renewable portfolio standards. However, some policies are more effective than others. Analyzing the renewable energy potential of advanced countries and combining these with indigenous factors is leading developing countries to create renewable energy technologies in their energy supply structures. This paper analyses the effect of different policy instruments in the renewable energy sectors in the Geographical Axis. Measures are analyzed and policy recommendations which, when considered, contribute to achieving renewable energy, thereby reducing emissions, mitigating climate change, and providing a clean environment and clean energy for all and future generations. It also investigated the opportunities associated with renewable energy sources, such as energy security.
Keywords: Renewable energy, Energy policy, Geographical axis, Energy Access, Social and Economic Development.
Resumen: La limitación de las fuentes de energía convencionales, por un lado, y la preocupación por el medio ambiente, por otro, han llevado a los países a promover cada vez más las tecnologías de energías renovables. Los instrumentos de política energética desempeñan un papel crucial en la aplicación de la innovación y la reducción de costes en la producción de energías renovables. Los distintos países aplican diversas políticas para promover las tecnologías de energías renovables, como subvenciones de capital, tarifas de alimentación, certificados negociables y normas de cartera de energías renovables. Sin embargo, algunas políticas son más eficaces que otras. El análisis del potencial de energías renovables de los países avanzados y su combinación con factores autóctonos está llevando a los países en desarrollo a crear tecnologías de energías renovables en sus estructuras de suministro energético. Este documento analiza el efecto de diferentes instrumentos políticos en los sectores de las energías renovables en el Axis Geografico. Analiza medidas y recomendaciones políticas que, si se tienen en cuenta, contribuyen a conseguir energías renovables, reduciendo así las emisiones, mitigando el cambio climático y proporcionando un medio ambiente y una energía limpios para todos y para las generaciones futuras. También investigó las oportunidades asociadas a las fuentes de energía renovables.
Palabras clave: Energías renovables, Política energética, Eje geográfico, Acceso a la energía, Desarrollo social y económico.
Introduction
Analysis of the theoretical basis of the research
The world is fast becoming a global village, where supply chains are disrupted due to the increasing daily requirement of energy by all populations worldwide while the earth in its form cannot change. The need for energy and related services to satisfy human social and economic development, welfare and health is increasing.
All regions of society call for energy services and the resource distribution network to meet basic human needs such as health, lighting, cooking, space comfort, mobility and communication and serve as generative processes (Edenhofer et al., 2011) securing the energy supply and curbing energy contribution to climate change are the two overriding challenges of the energy sector on the road to a sustainable future (Abbasi & Abbasi, 2010; Kaygusuz, 2012).
It is overwhelming to know in today’s world that 1.4 billion people lack access to electricity, while 85.0 % of them live in rural areas. As a result of this, the number of rural communities relying on the traditional use of biomass is projected to rise from 2.7 bn today to 2.8 bn in 2030 (Kaygusuz, 2012).
In recent decades, Asian countries have experienced a rapid economic growth rate and their need for secure energy sources is becoming more important due to this economic growth. The lack of fossil energy sources in these countries and environmental issues have led to their tendency to use renewable energy sources such as solar, wind and tide energy. Meanwhile, these countries have good potential to use renewable energy sources. Some benefit from strong wind streams and others from sun rays. According to the research carried out, the development and integration of green energies in the consumer market within the geographical axis is problematic.
Market research shows a high production cost of renewable energy. These costs represent a challenge in the development of green technologies. Green energy remains higher than conventional energy sources.
In this regard, the government’s effective policy at the level of the geographical axis can deploy innovation and cost reduction as a consequence of innovation. Different policy tools like feed-in tariffs, tradable certificates, renewable portfolio standards, tax incentives, and production quotas have a crucial role in promoting innovation in renewable energy technologies.
Considering the importance of these policies this paper compares the effects of various policy tools on renewable energy development among specific countries.
Following the research of the global renewable energy industry, the following two Asian countries the Republic of Korea, and the People’s Republic of China were analysed as our case studies even though some policy tools are in the initial stages in these countries, and it is early to evaluate the effectiveness of such policies.
Investigation of two advanced countries, including the European Union (EU) and the United Kingdom, on the geographical axis gives an overview of the analysis of renewable energy.
The oil crisis of the 1970s was brought about by two specific events occurring in the Middle East, the Yom-Kippur War of 1973, and the Iranian Revolution of 1979. Both events resulted in disruptions of oil supplies from the region which created difficulties for the nations that relied on energy exports from the region. Canada, Australia, New Zealand, the U.S., Western Europe, and Japan experienced large shortages in petroleum supplies and as a result, suffered high prices.
The countries named above were hard hit because they were industrial centers in the world economy which had a large demand for cheap oil exports from the Middle East.
By 1970 the Organization of Oil Exporting Countries (OPEC) had steadily been expanding its share in the market, by 1973 OPEC was supplying 56.0 % of the world’s oil, up from 47.0 % in 1965 (Nersesian, 2014). The effects of this conflict were short-lived on the economy however, nations had already mobilized efforts to stabilize oil supplies after the 1973 crisis. Other oil sources had been under development in Alaska, the Gulf of Mexico, Siberia, Canada, and the North Sea (Maugeri, 2006). In addition, countries dependent on oil from the Middle East region had begun to shift away from oil as an energy source to avoid fluctuations in supply and price (Maugeri, 2006).
Countries reliant on OPEC oil sought to mitigate the effects of rising prices and dependence by replacing oil with other fuel sources such as coal, nuclear power, and natural gas. The switch to coal for electrical generation was a simple change, in addition, more research was done, and emphasis was placed on the use of nuclear power to encourage the switch from oil (Toth & Rogner, 2006).
Research into alternate sources of energy dates back to the late 90s when the world started receiving the shock from oil producers in terms of price hiking (Abbasi, Premalatha, & Abbasi, 2011). It is evident in the literature that replacing fossil fuel-based energy sources with renewable energy sources, including bioenergy, direct solar energy, geothermal energy, hydropower, wind, and ocean energy (tide and wave), would gradually help the world achieve sustainability.
Governments, intergovernmental agencies, interested parties and individuals in the world today look forward to achieving a sustainable future due to the opportunities created in recent decades to replace petroleum-derived materials from fossil fuel-based energy sources with alternatives in renewable energy sources.
Sustainable development has become the centre of many countries' national policies, strategies, and development plans. International groups proposed a set of worldwide Sustainable Development Goals (SDGs) which included 17 goals and 169 targets at the UN in New York by the Open Working Group. These goals form a core element in the analysis of the work. A preliminary set of indicators was introduced in March 2015 to promote and implement renewable resources (Lu, Nakicenovic, Visbeck, & Stevance, 2015).
The Sustainable Development Goals (SDGs) give the scientific community stability and perspective towards the Millennium Development Goals. In addressing climate change, renewable energy, food, health, and water provision requires a coordinated global monitoring and modelling of many factors which are socially, economically, and environmentally oriented (Hák, Janoušková, & Moldan, 2016; Owusu, Asumadu-Sarkodie & Ameyo, 2016).
The recent launch of a set of global SDGs is helping to make sure that climate change for the twenty-first century and its impacts are combated, and a sustainable future is ensured and made as a bequest for future generations (Edenhofer et al., 2011; Lu et al., 2015).
The remainder of the paper is sectioned into five parts: In the first step, a case study of some selected countries including South Korea, China, the UK + and UE will be evaluated and after identifying their advantages and system failures the results will be compared and finally, a comprehensive pattern will be developed for other countries. Section 2 discusses renewable energy sources and sustainability and climate change, Section 3 elaborates on the various renewable energy sources and technologies, Section 4 elaborates on renewable energy sources and sustainable development, Section 5 elaborates on challenges affecting renewable energy sources and policy recommendations and Section 6 provides conclusion on the study.
Renewable energy sources and sustainability
Renewable energy sources are naturally replenished without running out in the ground; these include bioenergy, hydropower, geothermal, solar, wind and ocean energy (tides and waves). Principal types of renewable energy forms and their uses are presented in Table 1.
An analysis of the sustainability of new resources (Tester, Drake Driscoll, Golay & Peters, 2005) defines sustainable energy as, “a dynamic harmony between the equitable availability of energy-intensive goods and services to all people and preservation of the earth for future generations”.
The increasing regional demand for power requirements, alongside increasing population, led to the continual use of fossil fuel-based energy sources (Coal, Oil and Gas) and unequal distribution of resources to the population which became problematic by creating several challenges such as depletion of fossil fuel reserves, greenhouse gas emissions and other environmental concerns, geopolitical and military conflicts, and the continual fuel price fluctuations in the geographical axis.
These problems will create unsustainable situations, eventually resulting in a potentially irreversible threat to human societies (UNFCC, 2015), leading to the severing of economic links and disruption in the grid.
Notwithstanding, renewable energy sources are the most outstanding alternative and the only solution to the growing challenges in modern societies' need for energy when a comparison between Asia and Europe in terms of green energy development potential is analysed (Tiwari & Mishra, 2011).
Research shows that 22.0 % of the world's total energy supply comes from renewable energy. The resulting share represents an increase in investment over the last ten years (U.S. Energy Information Administration, 2012). While 2022 did see an increase in fossil fuel electricity generation for the EU, Ember is expecting it to decline in 2023 by as much as 20.0 %. Provided the EU's geographical focus can support this accelerated transition away from fossil fuels, this electricity generation primary source grid could include many more renewable and low-carbon energy sources shortly[2].
A reliable energy supply is essential in all economies for heating, lighting, industrial equipment, transport, etc.[3] renewable energy sources are important because they significantly reduce greenhouse gas emissions if replaced by fossil fuels. As renewable power resources are naturally derived from the continuous flow of energy in our environment, they should be sustainable.
To be sustainable, renewable sources of green electricity must be unlimited and provide green goods and services. For instance, a real sustainable biofuel should not increase net CO2 emissions, negatively affect food security, or threaten biodiversity (Twidell & Weir, 2015). Besides the notable advantages of renewable energy sources, economic efficiency analysis has some shortcomings, such as the interruption of production due to seasonal variations, because most renewable energy resources are climate-dependent, which is why their exploitation requires complex design, planning and control optimisation methods. Thankfully, continuous technological progress in hardware and software allows scientific researchers to solve these optimisation difficulties using computational resources applicable to renewable and sustainable power (Baños et al., 2011).
| Energy sources | Energy conversion and usage options |
| Hydropower | Power generation |
| Biomass Energy | Heat and power generation, pyrolysis, gasification, anaerobic |
| Geothermal Power | Urban heating, power generation, hydrothermal, hot dry rock |
| Solar Energy | Solar home system – Photovoltaic |
| Solar-powered urban Indoor Farm to help feed a city. An indoor vertical farm project powered by solar panels | |
| Wind energy | Power generation, wind generators, windmills, water pump |
| Wave and tide energy power | Numerous projects under consideration, barrage, tidal stream |
Renewable energy and climate change
Presently, the term “climate change” is of great interest to the world, in scientific and political discussions. Climate has been changing since the beginning of creation, but what is alarming is the speed of change in recent years and it may be one of the threats facing the earth. The growth rate of carbon dioxide has increased over the past 36 years (1979–2014) (Asumadu-Sarkodie & Owusu, 2016a2016c), “averaging about 1.4 ppm per year before 1995 and 2.0 ppm per year after that” (Earth System Research Laboratory, 2015).
The United Nations Framework Convention on Climate Change defines climate change as being attributed directly or indirectly to human activities that alter the composition of climate observed over comparable periods (Fräss-Ehrfeld, 2009).
Renewable technologies are considered clean resources of power, and the optimal use of these resources reduces their environmental impact, produces minimal secondary waste and is sustainable based on current and future economic and social demand renewable energy technologies provide an exceptional opportunity for the mitigation of greenhouse emissions and reducing global warming through substituting conventional energy sources (fossil fuel-based) (Panwar, Kaushik, & Kothari, 2011).
Renewable energy sources and technology
The analysis indicates that economic development is largely dependent on energy resources. In this way, increasing the social welfare of the countries and increasing their competitiveness in the global arena depends on their energy potential energy use directly or indirectly affects human life in many areas such as transportation, heating, communication, lighting, industry, tourism, and agriculture.
Regenerative power sources are energy supplies derived from the natural and persistent flow of energy that occurs in our environment.
They include bioenergy, direct solar energy, geothermal energy, hydropower, wind, and ocean energy (tide and wave) (Table 2).
From a household perspective, the use of renewable energy technologies offers a considerable number of benefits, it improves living conditions by using energy more productively, contributes to sustainable spatial planning and architecture, helps to protect the quality of the environment, and distributes energy in a balanced way and thus gives financial autonomy like Solar photovoltaic (PV) and solar thermal, micro-wind, heat pumps, and small-scale biomass heating technologies can be distinguished as the main renewable energy technologies in households (Su et al, 2018). Renewable energy technologies used to improve housing quality are based on the use of green energy.Solar energy, Wind energy, Biomass. The technologies presented in Table 2 represent a technological transposition of green energies.
| Hydropower Definition | Hydropower or hydroelectric power is an essential renewable power source produced using the energy of falling or fast-moving water. A hydroelectric power plant that uses a dam, will release water from higher elevation falling to lower levels where the facility uses turbines and generators to turn the kinetic energy into clean electricity without releasing harmful emissions. The operation of hydropower reservoirs often reflects multiple uses, e.g, flood and drought control (Asumadu-Sarkodie, Owusu, & Jayaweera, 2015; Asumadu-Sarkodie, Owusu, & Rufangura, 2015), irrigation, drinking water and navigation (Edenhofer et al., 2011). The primary energy is provided by gravity and the height at which the water falls onto the turbine. The storage tank level changes somewhat when water is released and consequently influences electricity production. Turbines set in motion by water produce energy (Førsund, 2015). Hydropower produces no polluting particles, can be upgraded promptly and is capable of accumulating energy for several hours. (Hamann, 2015) being an essential renewable power source. |
| Hydropower functionality | According to the World Energy Council Report, about 50.0 % of hydropower installed capacity is among four countries namely China, almost 650 TWh are generated in an average hydrological year, which equates to about 65.0 % of the economically feasible hydropower potential within the European Union include the UK. (World Energy Council, 2013) (https://hydropower-europe.eu/). The existing hydropower production system is estimated to be less than 0.1 %, even though additional research is needed to lower the uncertainties of these projections (Edenhofer et al., 2011). As the second largest renewable electricity source, hydropower continues to be an important source. According to Eurostat, it accounted 2020 for 33.0 % of the EU’s renewable electricity production and provided 17.0 % of the EU’s electricity. |
| Bioenergy definition | Bioenergy is a renewable source of energy derived from biological supplies. Bioenergy is an important source, which can be used for transport using biodiesel, and power generation. Electricity produced from bioenergy draws on a wide range of different sources, including forest by-products, agricultural residues and livestock residues such as cow dung. Another advantage of biomass electricity is that the fuel is often a by-product, residue, or waste from the above sources. Significantly, it does not create competition between land for food and land for fuel (Urban & Mitchell, 2011). Presently, global production of biofuels is comparatively low, but continuously increasing (Ajanovic, 2011). |
| Bioenergy functionality | Biomass has a large potential to meet the greenhouse gas reduction target and could secure future fuel supplies. Hoogwijk, Faaij, Eickhout, de Vries and Turkenburg (2005), pointed that the availability of resources is an important factor for high shares of biomass to penetrate the electricity, heat or liquid fuel markets. We have analysed the geographical and technical potential of energy crops for the years 2050–2100 for three land-use categories: abandoned agricultural land, low-productivity land and ‘rest land’, i.e. remaining nonproductive land. Regarding biomass, the study focuses on an environmentally acceptable and sustainable source to mitigate climate change (Demirbas, Balat and Balat, 2009). Most of the suitable land for biomass production is already in use (Ajanovic, 2011). Current studies have shown both positive and negative environmental and socio-economic effects of bioenergy (Koh & Ghazoul, 2008). Diversion of crops or land into bioenergy production can induce food commodity prices and food security (Headey & Fan, 2008). Proper operational management can bring about some positive effects which include enhanced biodiversity (Baum, Leinweber, Weih, Lamersdorf, & Dimitriou, 2009; Schulz, Brauner, & Gruß, 2009), soil carbon increases and improved soil productivity (Baum et al., 2009;Edenhofer et al., 2011). |
| Solar energy | The word “direct” solar energy refers to the energy base for those renewable energy source technologies that draw on the Sun’s energy directly. Solar energy technology is obtained from solar irradiance to generate electricity using photovoltaic(PV) (Asumadu-Sarkodie & Owusu, 2016c) and concentrating solar power (CSP), to produce thermal energy, to meet direct lighting needs and, potentially, to produce fuels that might be used for transport and other purposes (Edenhofer et al., 2011). According to the World Energy Council (2013), “the total energy from solar radiation falling on the earth was more than 7,500 times the World’s total annual primary energy consumption of 450 EJ” (Urban & Mitchell, 2011). |
| Wind energy | Wind is used to produce electricity by converting the kinetic energy of air in motion into electricity. In modern wind turbines, wind rotates the rotor blades, which convert kinetic energy into rotational energy. This rotational energy is transferred by a shaft to the generator, thereby producing electrical energy. Wind exists all over the world, in some places with high energy density (Manwell, McGowan, & Rogers, 2010). Wind energy harnesses kinetic energy from moving air. The primary application of the importance of climate change mitigation is to produce electricity from large turbines located onshore (land) or offshore (in the sea freshwater) (Asumadu-Sarkodie & Owusu, 2016b). Onshore wind energy technologies represent a huge development potential that is ready to be implemented. (Edenhofer et al., 2011). Wind turbines convert the energy of wind into electricity. |
| Geothermal Energy | Geothermal energy resources are found in geological systems that must be well understood through geological, geochemical, and geophysical investigation (before drilling and testing). Future developments in geothermal energy may include technological advancements to reduce drilling costs, the development of enhanced geothermal systems, or further coproduction of geothermal energy from oil and gas reservoirs (Rosalind Archer, 2020). |
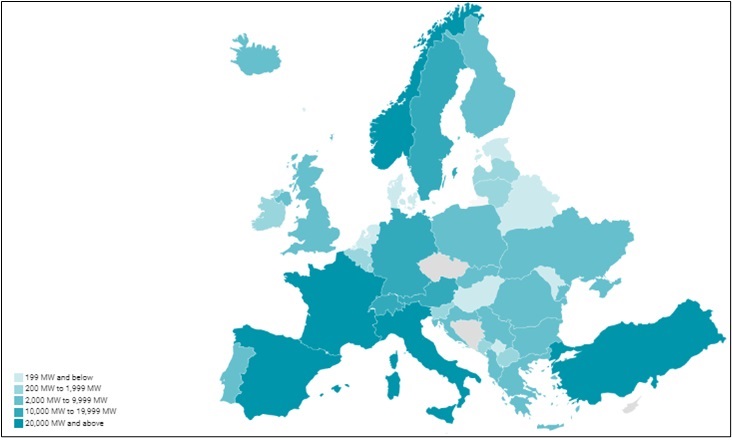
It is worth mentioning that the European Union is a political axis that unites the geographical area of Europe (Figure 1).
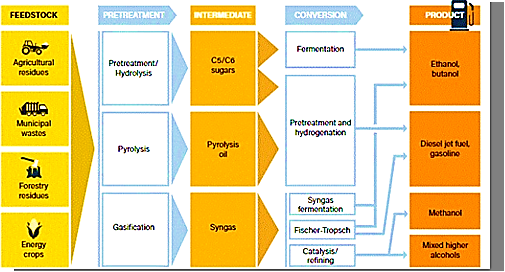
Biomass can be used to manufacture both hydrocarbon fuels and chemical compounds such as rubber, alcohols, lipid-based products, sugars, etc. Due to their abundant supply and lower greenhouse gas emissions, fuels derived from biomass have received much attention in recent years. Biofuels can be made from grasses, agricultural waste, animal waste and trash, old oils, and other organic things. The characteristics of various feedstocks and fuels, as well as the techniques for converting biomass to biofuels, physical and chemical parameters, and limitations that affect biomass-to-fuel conversion, are all discussed. pH, temperature, and residence time are all process parameters. Other chemical factors include the availability of carbon, nutrients, acid and alkaline hydrolysis agents, phenolic inhibitors, and sugars produced throughout the process. The list of obstacles to biomass bioconversion includes reduced particle size, crystallinity, fermentation-inhibitory byproducts, cellulase deactivation, yeast ethanol tolerance, and sugar co-fermentation. The research and development of biomass-to-energy conversion technology have been accelerating significantly, according to this review. The choice of the conversion method depends on the type and quality of the biomass, the final energy form, environmental requirements, economic conditions, and project-specific considerations (Figure 2). Biowaste is initially improved (depending on the conditions). This process includes size reduction, densification, drying, and torrefaction. The two most popular conversion methods for biomass to energy are thermochemical and biochemical, utilizing the power of microorganisms, biochemical conversion transforms biomass into liquid or gaseous fuels. The processes of anaerobic digestion, fermentation, and photobiological hydrogen generation are currently the most widely used biochemical technologies (Gnanasekaran, Priya, Thanigaivel, Hoang, Soto-Moscoso, 2023).
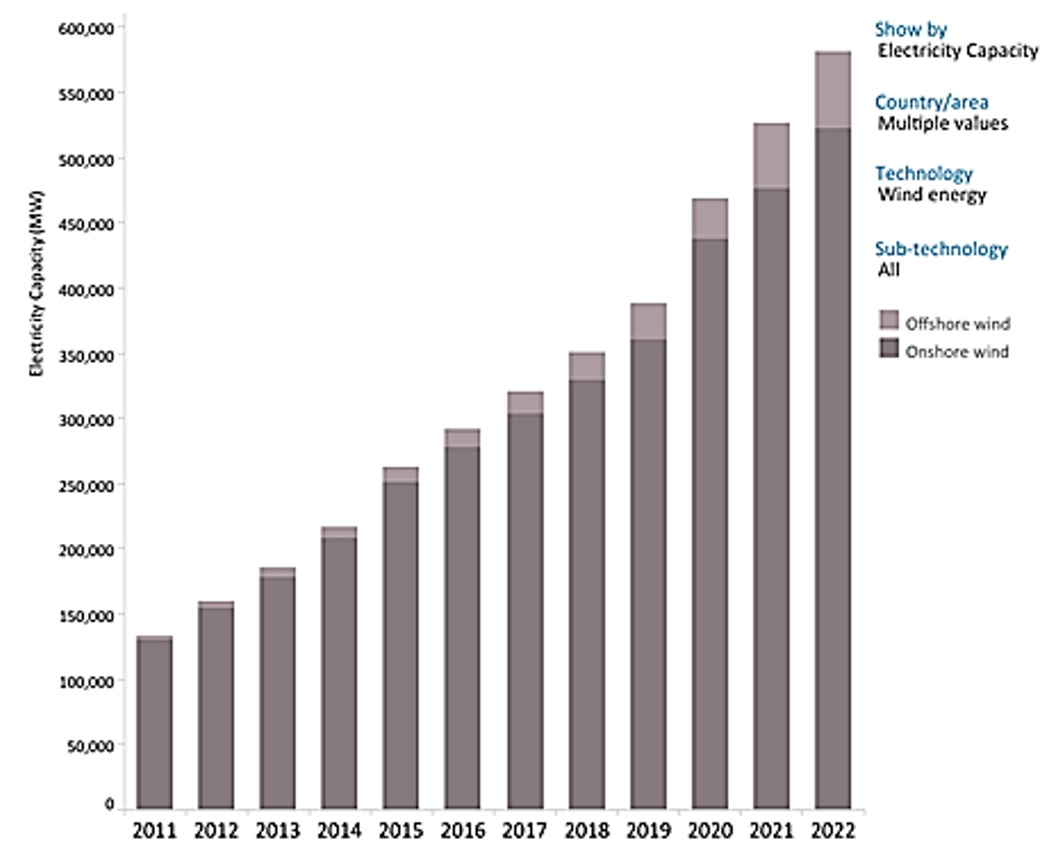
Wind power has grown rapidly since 2000, driven by R&D, supportive policies and falling costs. Global installed wind generation capacity – both onshore and in the open sea– has increased by a factor of 98 in the past two decades, jumping from 7.5 GW in 1997 to some 733 GW by 2018 according to IRENA’s data. Onshore wind capacity grew from 178 GW in 2010 to 699 GW in 2020, while in the open sea, wind has grown proportionately more, but from a lower base, from 3.1 GW in 2010 to 34.4 GW in 2020. Production of wind power increased by a factor of 5.2 between 2009 and 2019 to reach 1412 TWh. (Figure 3).
Renewable energy promotion policies
Policies whose specific goal is to promote renewable energy fall into three main categories: (a) price-setting and quantity-forcing policies, which mandate prices or quantities; (b) investment cost reduction policies, which provide incentives in the form of lower investment costs; and (c) public investments and market facilitation activities, which offer a wide range of public policies that reduce market barriers and facilitate or accelerate renewable energy markets. Historically, governments have enacted these policies in an ad-hoc manner.
More recently, national renewable energy targets (also referred to as goals) have emerged as a political context for promoting specific combinations of policies from all three categories. Such targets focus on the aggregate energy production of an entire country or group of countries. Targets may specify total primary energy from renewables and/or minimum renewable energy shares of electricity generation. In June 2021, the EU adopted a European Climate Law, establishing the aim of reaching net zero greenhouse gas emissions (GHG) in the EU by 2050. The law sets an intermediate goal of reducing GHG by at least 55.0 % by 2030 compared to 1990. The ‘Fit for 55’ package is a set of policy proposals by the European Commission to achieve this 55.0 % reduction goal. For these proposals to come into effect, the European Parliament and the Council must jointly approve them[4].
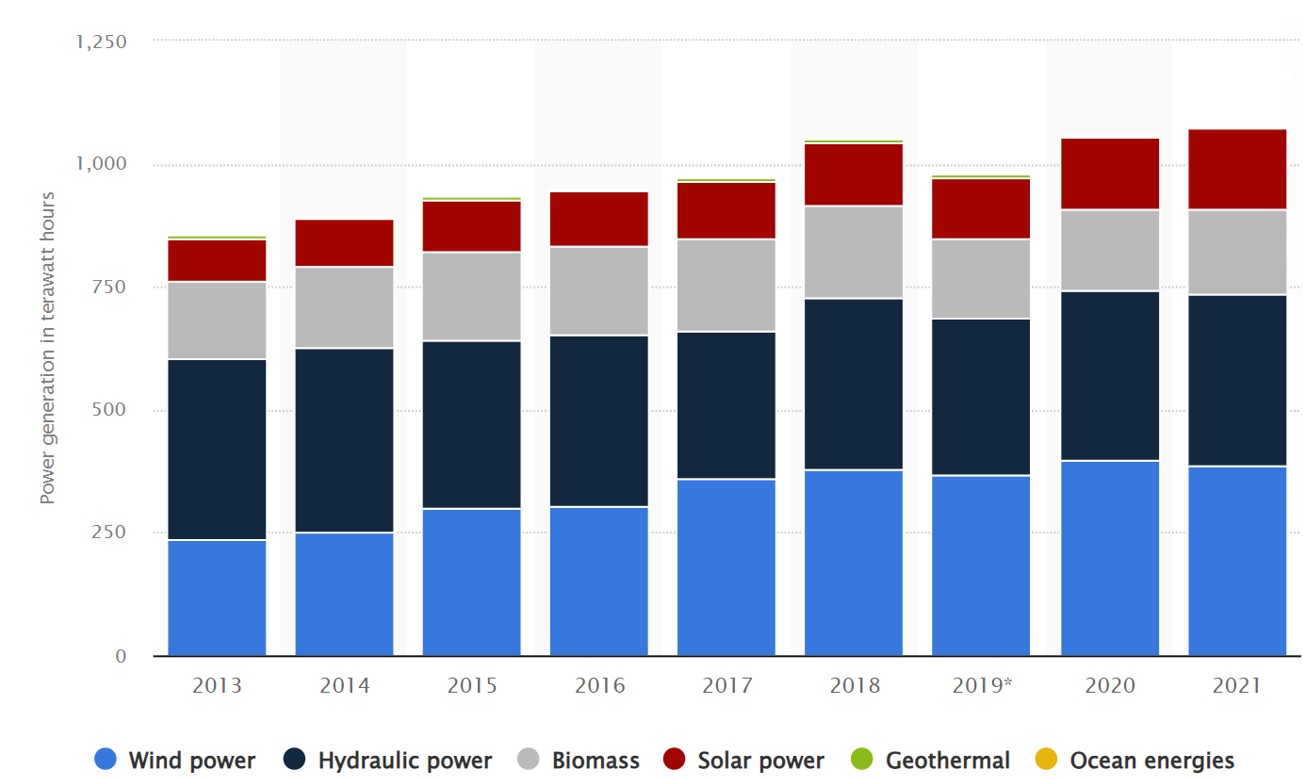
Renewable energy mix in the European Union 2013-2021. Since 2017, wind power has as the main renewable source in the European Union's electricity mix. In 2021, electricity from wind power accounted for 35.8 % of the EU's renewable mix. Hydropower was the major renewable source in the EU's electricity mix in the prior years. By comparison, ocean and geothermal power were the renewable sources with the lowest electricity generation in the region in 2021, with 0.5 and 6.5 TWh, respectively (Figure 5).
China and India are the first developing countries to propose renewable energy targets. India has proposed that by 2012, 10.0 % of annual additions to power generation would be from renewable energy; China has a similar goal of 5.0 % by 2010, and South Korea has 30.0 % of the total energy used to come from renewable resources.
Methodology
The methodology used at multiple stages in a policy design and implementation cycle becomes an iterative process, such that previous experience informs improvements to policy design and implementation, and the development of new policies and comparison between Asia and Europe.
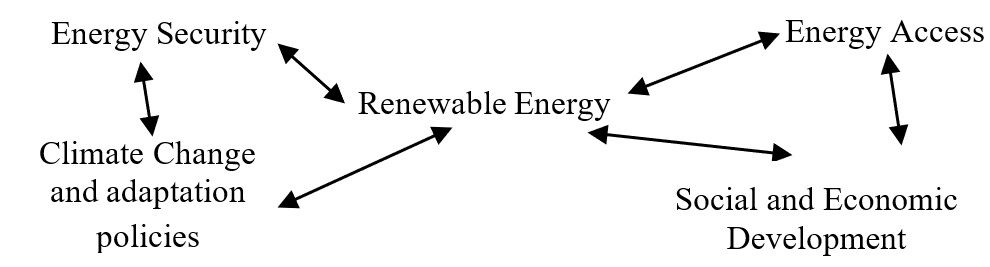
Figure 6 points to the opportunities for renewable energy sources towards sustainable development. Policies to support renewable resources provide opportunities for energy security, social and economic development, energy access, climate change mitigation and reduction of environmental and health impacts (Asumadu-Sarkodie & Owusu, 2016c).
Incentive mechanisms are a core enabler of the expansion in renewable energy capacity. The methodology focuses on renewable energy policies that are widely implemented and are successful in advancing renewable energy deployment:
· supply network policies, including geographical supply axis: policies aimed at promoting renewable energy renewables through the realisation of geographical axis energy;
· discusses renewable energy sources and sustainability and climate change, elaborates on the various renewable energy sources and technologies, elaborates on renewable energy sources and sustainable development, elaborates on challenges affecting renewable energy sources and policy recommendations;
· determine the objective of the assessment, Social and economic development;
· Addition renewable energy addition of the policy.
Results
To consolidate the analysis conducted efficiently, the results of the chapter have been structured as follows: Renewable energy and sustainable development, Challenges affecting renewable energy sources and Renewable Energy Policies, and Comparative analysis in the geographical axis between Asia and Europe in terms of share of green energy used.
Renewable energy and sustainable development
Renewable forms of power have a direct relationship with sustainable growth through their impact on human development and economic performance. (Asumadu-Sarkodie & Owusu, 2016b). Renewable energy sources provide opportunities for energy security, social and economic development, energy access, climate change mitigation and reduction of environmental and health impacts (Asumadu-Sarkodie & Owusu, 2016c).
The definition of sustainable energy management is widely used, but there is no consensus on its exact definition. Still, the concern for energy security is based on the idea that there is a continuous supply of renewable energy, which is essential for the functioning of an economy (Kruyt, van Vuuren, de Vries, & Groenenberg, 2009).
Given the interdependence of economic growth and energy consumption, access to a stable energy supply is of importance to the political world and a technical and monetary challenge for both developed and developing countries because prolonged interferences would generate serious economic and basic functionality difficulties for most societies (Edenhofer et al., 2011; Larsen et al. 2009). Renewable resources are evenly distributed around the world compared to conventional fossil fuels and are generally less traded on the market. Renewable energy reduces energy imports contributes diversification of the portfolio of supply options reduces an economy’s vulnerability to price volatility and represents opportunities to enhance energy security across the globe.
Renewables can also help increase the reliability of power services, especially in areas that often suffer from poor grid connectivity. A diversified portfolio of energy sources, together with good system management and design, can help increase safety (Edenhofer et al., 2011).
More generally, the power supply sector was seen as a key element for economic development, with a strong correlation between economic growth and growth in energy consumption. At a worldwide level, per capita income is positively correlated with per capita energy consumption and economic growth can be identified as the most important factor driving energy consumption growth in recent decades. It in turn creates employment; a renewable energy study in 2008, proved that employment from renewable energy technologies was about 2.3 million jobs worldwide, which also has improved health, education gender equality and environmental safety (Edenhofer et al., 2011).
Sustainable Growth Goal 7 (clean and affordable energy) aims to ensure that sustainable sources of power are clean, affordable, available, and accessible to all, and this can be achieved with the help of renewable energy sources as they are generally distributed around the globe. Access concerns need to be understood in a local context and in most countries, there is an obvious difference between electrification in the urban and rural areas, this is especially true in the South Asian region (Brew Hammond, 2010).
Distributed grids based on renewable energy are generally more competitive in rural areas with significant distances to the national grid and low levels of rural electrification offer substantial openings for renewable energy-based mini-grid systems to provide them with electricity access (Edenhofer et al., 2011).
Renewable energy sources used in energy generation help to reduce greenhouse gases which mitigates climate change and reduces environmental and health complications associated with pollutants from fossil fuel sources of energy. The change in total GHG emissions in the European Environmental Agency (EEA, 2016) comparison between 1990, 2000, 2010 and 2020 their GHG emissions per capita (Table 3).
| EU-27+UK | Total, net emissions with international aviation (EU NDC) | All greenhouse gases –(CO2 equivalent) per/years | Emissions (kt CO2 eq) | GHG emissions per capita |
| 1990 | 5,509,495 | 11.54 | ||
| 2000 | 4,997,345 | 10.21 | ||
| 2010 | 4,594,656 | 9.12 | ||
| 2020 | 3,544,794 | 6.89 |
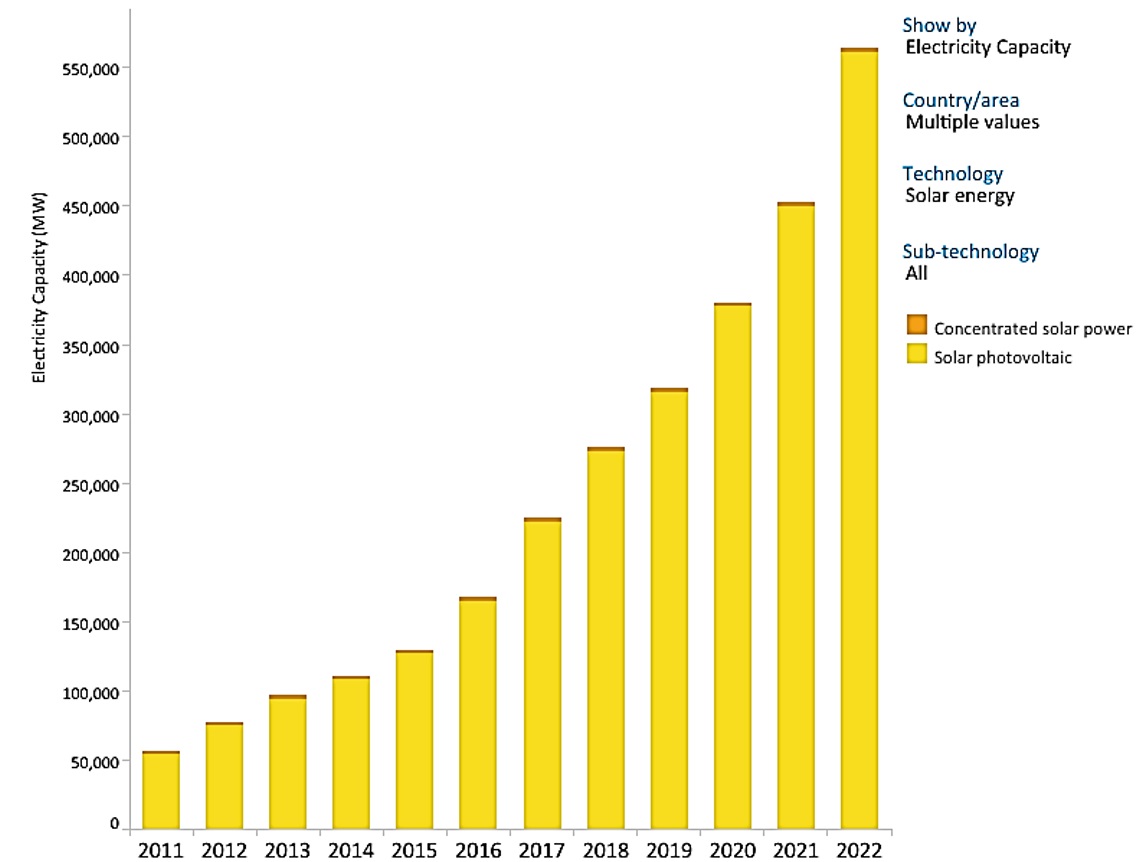
In 2022, wind and solar generated a record fifth of EU electricity (22.0 %), for the first time, overtaking fossil gas (20.0 %) and remaining above coal power (16.0 %). Solar generation rose by a record 39 TWh (24.0 %) in 2022, helping to avoid 10 € bn in gas costs. This was due to record installations of 41 GW in 2022, 47.0 % more than was added in 2021. Twenty EU countries achieved their highest-ever share of solar electricity (Figure 4). The Netherlands was the leader, producing 14.0 % of its power from solar—overtaking coal generation for the first time.
Greece ran solely on renewables for five hours in October and is expected to reach its 2030 solar capacity target of 8 GW by the end of 2023, seven years early.
For the first time, wind and solar reached over a fifth (22.0 %) of EU electricity in 2022[5].
China is the world’s largest single consumer of bioenergy accounting for 23.0 % of global consumption. However, European countries, where the primary form of bioenergy for power is wood derived from forests, are also major consumers, accounting for a combined 27.0 % of global bioenergy consumption[6].
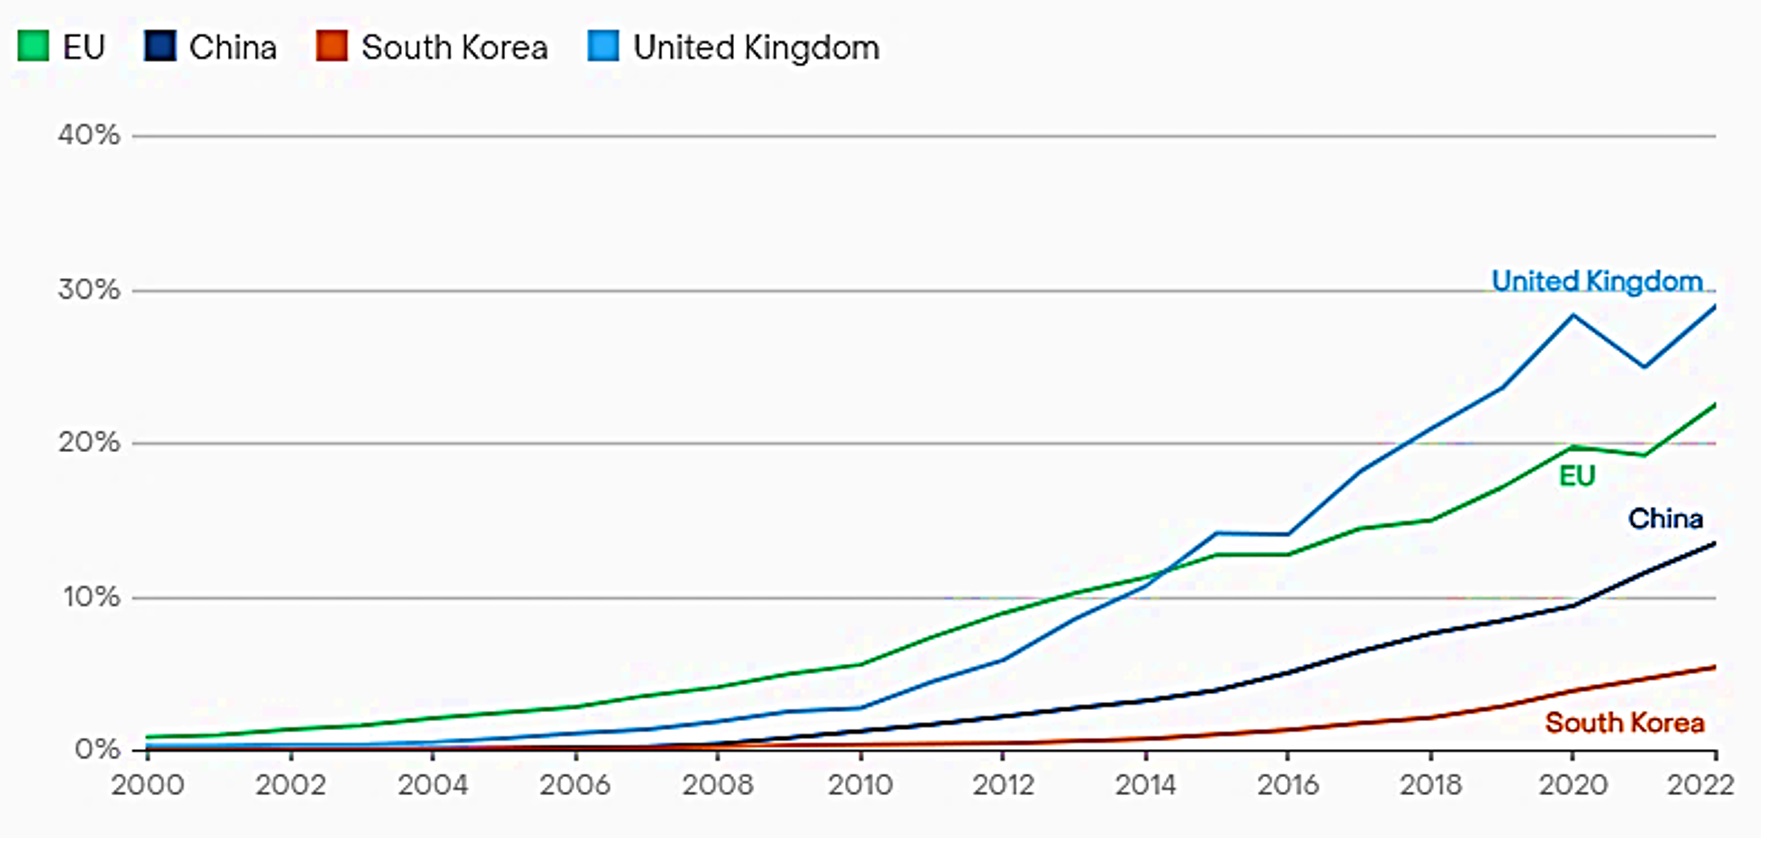
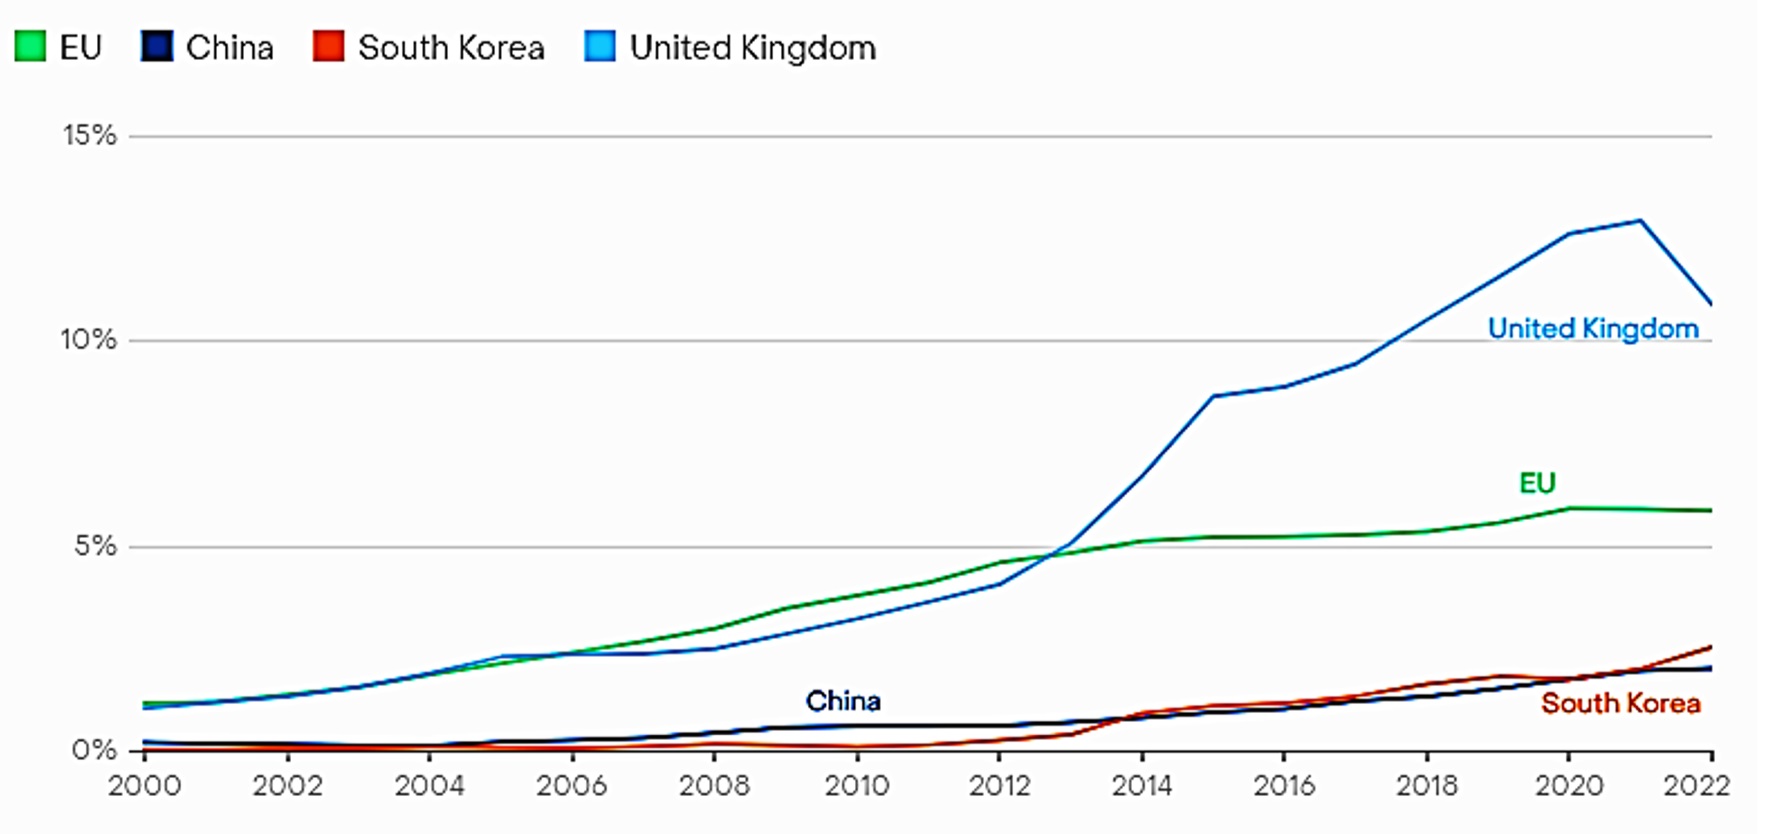
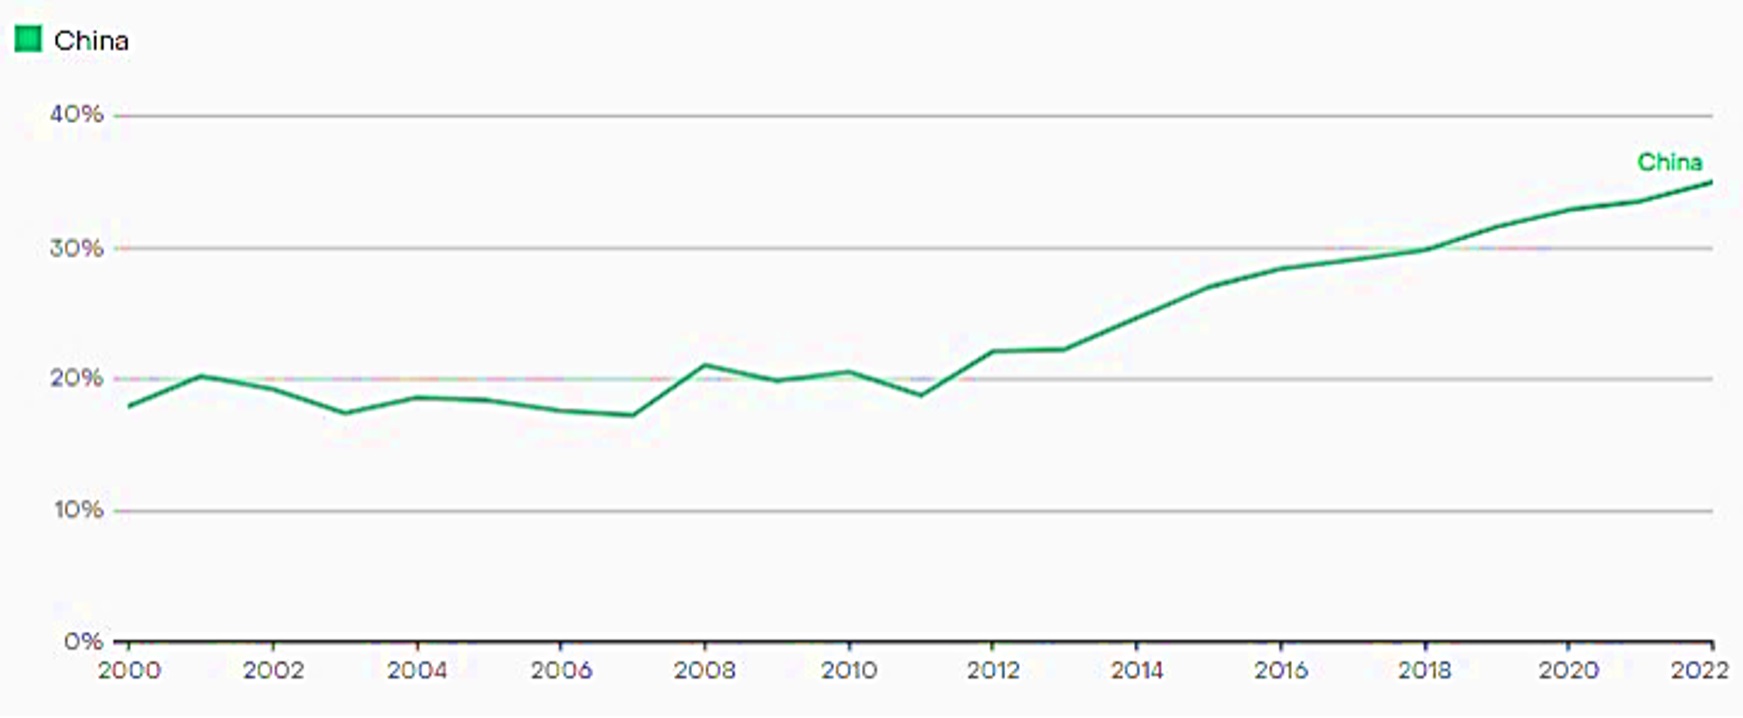
Percentage share at the geographical axis level is analysed: EU-UK-China-South Korea period 2000-2022 (Figure 7, Figure 8). Figure 7 shows that: the UK and EU the lead due to the investments made and the strong promotion policies
China’s 20th Party Congress in October 2022, outlining President Xi Jinping’s vision for the next five years, delivered no new headline policy updates on climate and environment but re-emphasised key trends of the last year[7]. This includes pushing for modernisation and efficiency gains in industry and energy systems, evolving the economy towards higher value and cleaner production, and the necessity of coal as a “backstop for energy security”. Ahead of COP26 in November 2021, China officially submitted to the UNFCCC its carbon neutrality “before 2060” goal and updated NDC (Nationally determined contributions) targets, strengthening its previous non-fossil share and carbon intensity targets, while adding a new renewable energy capacity goal. However, while China’s updated NDC was an improvement on previous targets, it leaves room for further objectifying ambition. We project that China is likely to comfortably overachieve its targets without substantially increasing its current mitigation efforts, despite increasing emissions in the short term (Figure 9). Renewable energy will also continue to be a national priority in parallel; installed capacity for renewables surpassed 1,000 GW in 2021.
Energy from non-fossil sources in China needs to grow by around 13.0 % by 2025 and 52.0 % by 2030 (from 2020 levels) to achieve its FYP (energy policies in China—from the Five-Year Plan perspective) and NDC targets. China issued new renewable targets in 2022, aiming to generate 3300 TWh of electricity from renewable sources by 2025, approximately 35.0 % more than it did in 2020.
From the Figure 7, it can be seen that China's P.R. has doubled its share of green energy from 20.0 % to almost 40.0 %.
Korea’s energy transition and the Green New Deal.
Korea’s energy sector is characterised by the dominance of fossil fuels, which in 2018 accounted for 85.0 % of the total primary energy supply (TPES), a strong dependence on energy imports at 84.0 % of TPES, and the dominance of industrial energy use at 55.0 % of total final consumption, the highest share among International Energy Agency (IEA) countries´. In 2018, Korea had the lowest share of energy from renewable sources in energy supply among all IEA countries[8].
The Korean government is committed to advancing the country’s energy transition by increasing the share of renewable electricity to 20.0 % by 2030 and to 30-35.0 % by 2040, to gradually phase out coal and nuclear from the energy mix while significantly improving energy efficiency and fostering the country’s nascent hydrogen industry.
Under the Paris Agreement, Korea is committed to limiting its emissions to 536 million tonnes of carbon dioxide equivalent (Mt CO2-eq) in 2030; in 2018, emissions were 709 Mt CO2-eq[9].
Challenges Affecting Renewable Energy Sources and Renewable Energy Policies
Renewable energy sources could become the major energy supply option in low-carbon energy economies. Disruptive alterations in all energy systems are necessary for tapping widely available renewable Energy sources. Organizing the energy transition from non-sustainable to renewable energy is often described as the major challenge of the first half of the twenty-first century (Verbruggen et al., 2010).
The following are policy recommendations emanating from the study that can help mitigate climate change and its impacts:
· All sectors and decisions have the potential to contribute by investing in Renewable energy technologies and policies to help reduce it;
· Reducing our carbon footprint through changes in lifestyle and behaviour patterns can contribute a great deal to the mitigation of climate change;
· renewable innovations and technologies that can reduce land use and reduce accidents from renewable energy sources and the risk of resource competition, for example in Bioenergy where food for consumption competes with energy production;
· enhancing international cooperation and support for developing countries towards the expansion of infrastructure and upgrading technology for modern supply and sustainable energy services as a way of mitigating climate change and its impacts.
Comparative analysis in the geographical axis between Asia (China, South Korea) and the EU in terms of the share of green energy used
In total, 15 of the 27 EU members reported a share over the 22.0 % average in 2022: Belgium, Bulgaria, Czechia, Germany, Ireland, Spain, France, Italy, Cyprus, Luxembourg, Hungary, Malta, Netherlands, Poland, and Slovakia.
The lowest proportions of renewables were recorded in Luxembourg (11.7 %), Malta (12.2 %), the Netherlands (12.3 %), Ireland (12.5 %) and Belgium (13.0 %). The average share of renewable energy in the EU is 22.0 % (Eurostat). The UK appears towards the bottom of the European rankings, with only 14.0 % of its energy coming from renewables in 2022.
In China, Renewable energy sources accounted for 14.9 % of the primary energy consumption mix in 2021[9] .
According to the Korea Power Exchange, the capacity of renewable energy came to 27,103 MW as of September, which marked 20.1 % of 134,719 MW in collective power generation facilities[10].
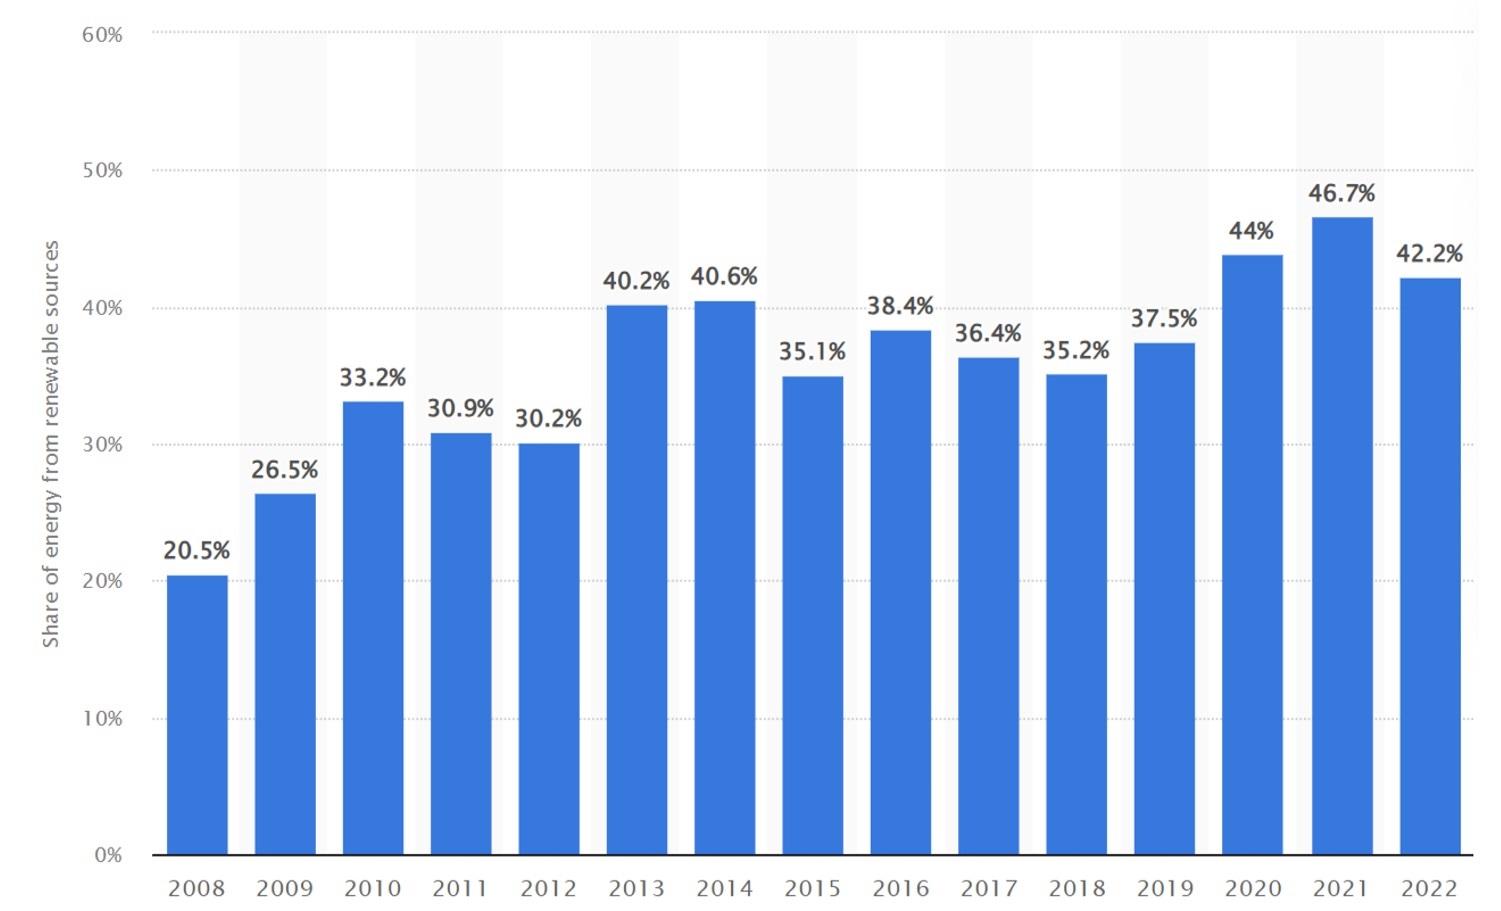
Example of an EU Member State that has seen increases in renewable energy use. EU-wide analysis for the period 2008-2022 shows growth in investment/member country. From 2008 to 2022, the share of energy from renewable sources in electricity generation in Spain climbed from 20.5 % to 42.2 %. Renewable electricity generation in the country peaked in 2021 at 46.7 % (Figure 10).
Figure 11 shows that the European Union has invested in environmental policies (with which the UK is associated) promoting renewable energies. Still, China and South Korea have come strongly from behind the economic potential with strong policies to adapt industry and economy to sustainable green points.
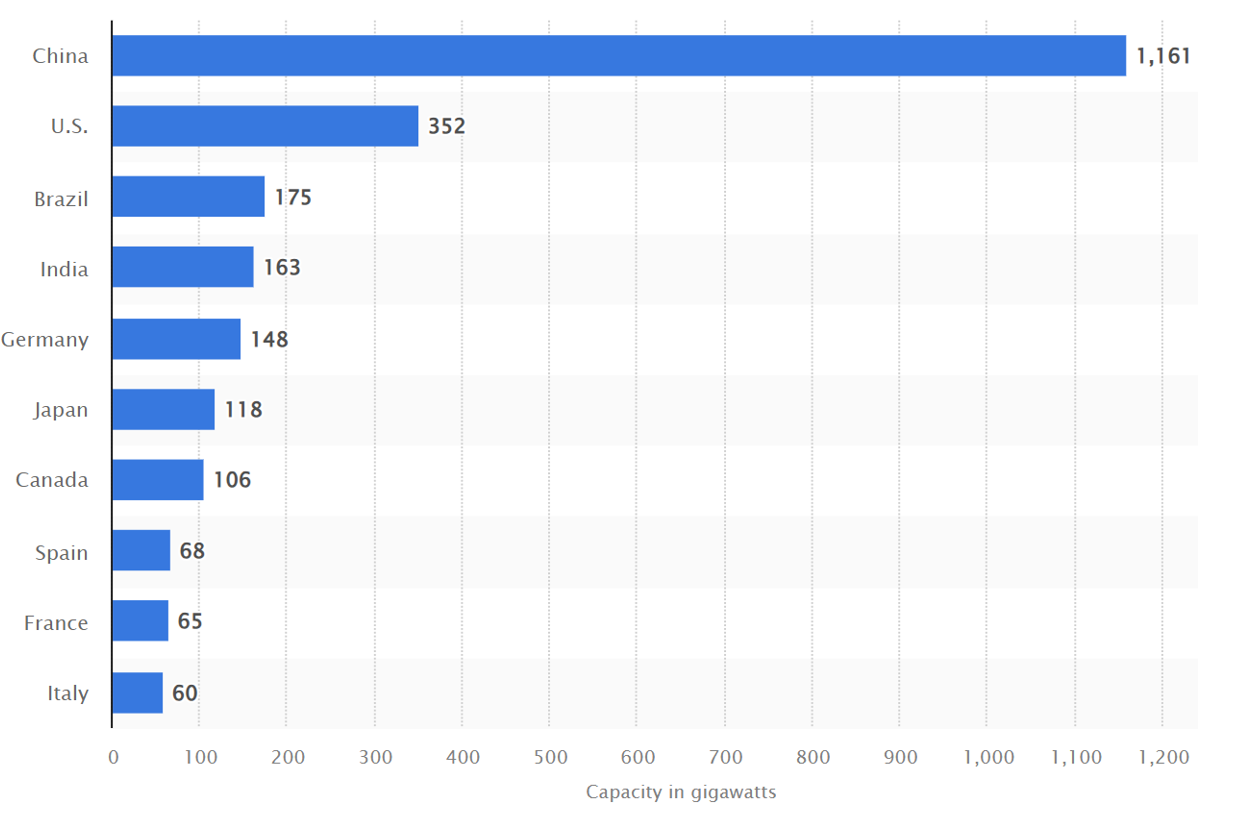
The leading countries for installed renewable energy in 2022 were China, the U.S., and Brazil. China was the leader in renewable energy installations, with a capacity of around 1,161 GW. The U.S., in second place, had a capacity of around 352 GW. Renewable energy is an important step in addressing climate change and mitigating the consequences of this phenomenon (Figure 12).
Renewable power capacity is defined as the maximum generating capacity of installations that use renewable sources to generate electricity.
Recent data suggests that renewable energy as a share of the world’s power production is increasing. Renewable energy consumption varies from country to country. The top Geographic Axis for renewable energy consumption are China, the United States, and Brazil, respectively.
There are various types of renewable energy sources used globally including, bioenergy, solar energy, hydropower, and geothermal energy, to name a few. Globally, China and Canada are the top two countries in terms of generating the most energy through hydropower. Geothermal energy has been on the rise as well. Data shows an increase in geothermal energy capacity globally in the last 10 years. Likewise, there has been a dramatic increase in the capacity of global solar energy in recent years.
The leading countries for installed renewable energy in 2022 were China, the U.S., and Brazil. China was the leader in renewable energy installations, with a capacity of around 1,161 GW. The U.S., in second place, had a capacity of around 352 GW. Renewable energy is an important step in addressing climate change and mitigating the consequences of this phenomenon (Figure 11). Renewable power capacity is defined as the maximum generating capacity of installations that use renewable sources to generate electricity. Recent data suggests that renewable energy as a share of the world’s power production is increasing. Renewable energy consumption varies from country to country. The top countries for renewable energy consumption are China, the United States, and Brazil, respectively.[11]
Analysis Trends in electricity capacity generated from green sources compared within the geographical axis
Capacity = Maximum Power Output
When it comes to generation capacity, think of maximum power output.
Capacity is the amount of electricity a generator can produce when it’s running at full blast. This maximum amount of power is typically measured in megawatts (MW), gigawatts (GW) or kilowatts (kW) and helps utilities project just how big of an electricity load a generator can handle. A megawatt (MW) is the standard unit used to measure electrical power in the International System of Units (SI). It measures equivalent to 1 million W or 1,000 kilowatts (kW).
European Union countries (part of the geographical axis) were selected for comparison analysis with the UK, South Korea, and China. The analysis is separate and countries within the European Union with a high share of electricity capacity in the selected green energy source Bioenergy. The geographical axis researched is composed of major bioenergy producers.
Austria-Germany-Belgium-France-Spain-Romania European Union member -UK-South Korea – China
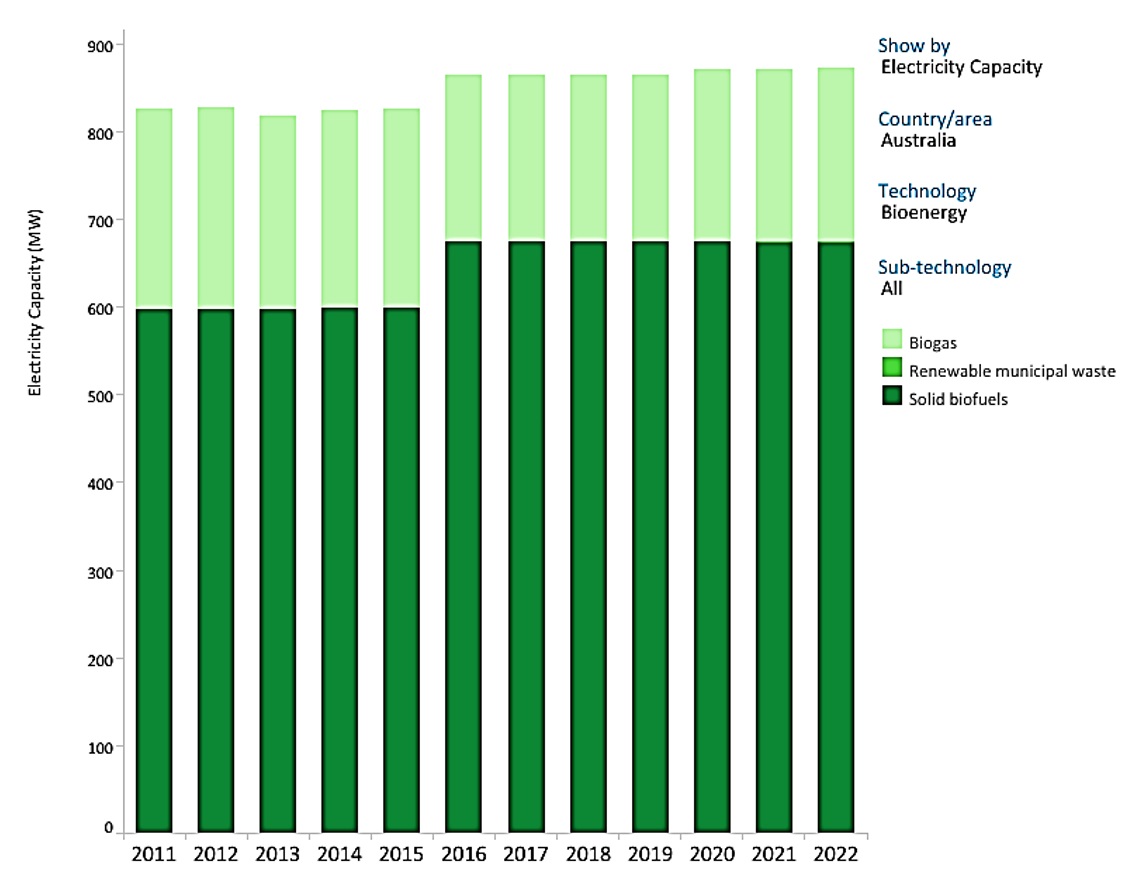
Austria: In 2011, a total of 800 MW of electricity was produced from Bioenergy, of which 600 MW from Solid Biofuels and 200 MW from Biogas. 2022 the level of electricity from Bioenergy will increase to 850 MW of which 650 MW from Solid biofuels and the rest from Biogas (Figure 12). There are two constants in the growth period 2011-2015 and 2016-2022. Average increase of 4.54 MW/year.
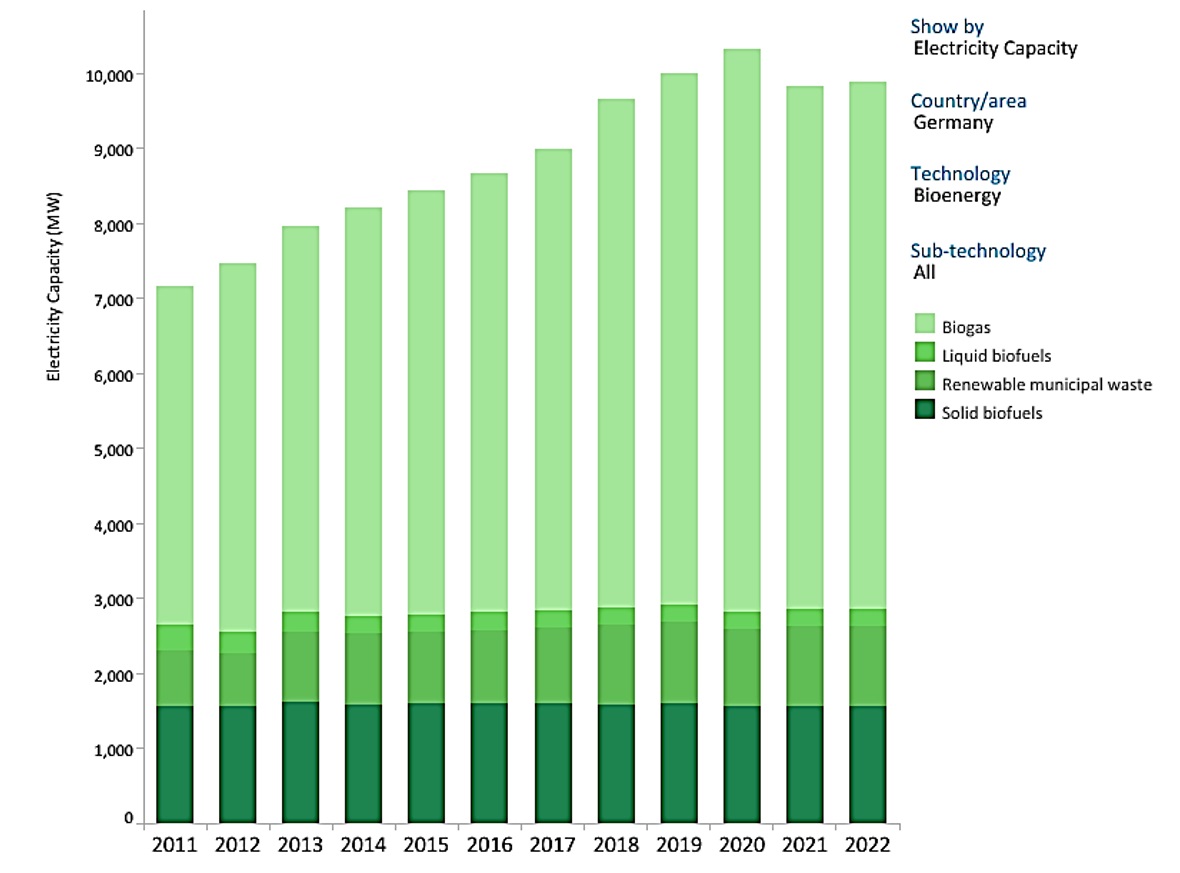
Germany: 2011 there is a level of 7000 MW energy from Bioenergy of which: 1500 MW solid biofuels, 1000 MW Renewable municipal waste, 200 MW liquid biofuels, and 5000 MW biogas. In 2022 there will be 9000 MW of energy from bioenergy, and in 2020 there will be 10000 MW of energy from bioenergy, a decrease of 1000 MW due to the crisis caused by COVID-19 and the war in Ukraine (Figure 13). A major increase in Bioenergy from biogas of 2000 MW. The diversity of the sources recorded is remarkable: solid biofuels, renewable municipal waste, liquid biofuels, and biogas an increase of 181.81 MW/year.
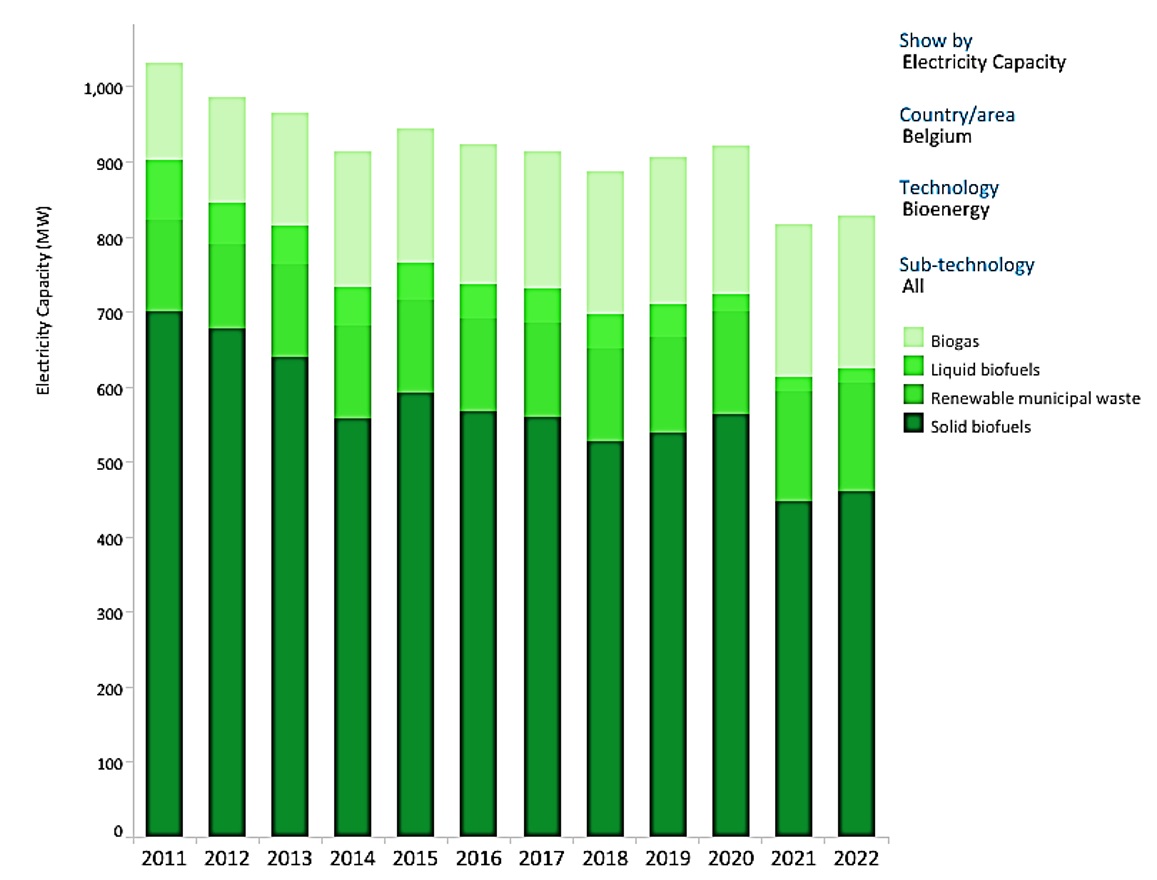
Belgium: 2011 there is a level of 1000 MW of energy from Bioenergy of which: 700 MW of solid biofuels, 100 MW of municipal waste, 100 MW of liquid biofuels, and 100 MW of biogas (Figure 14). There is a discontinuity in the level of MW from bioenergy, so in 2022 a level of 900 MW is recorded. Overall, a decrease of 9.09 MW/year.
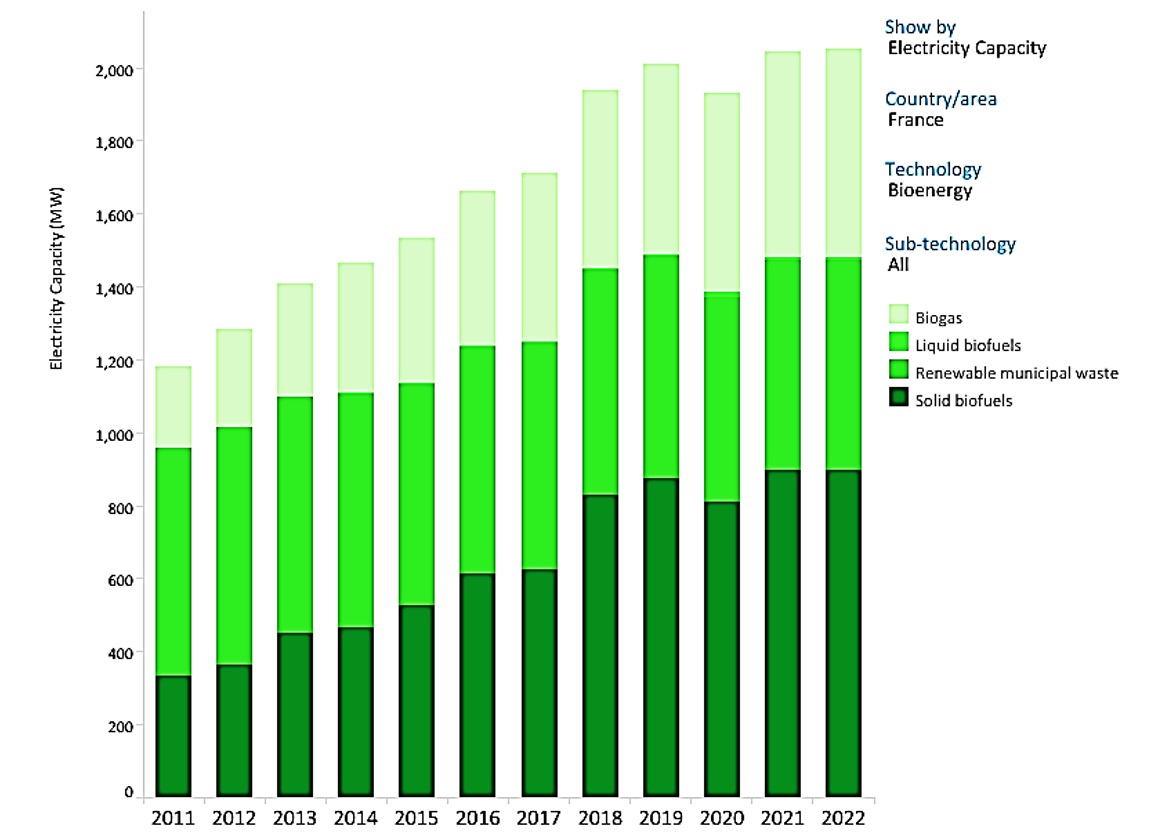
France: 2011 there is a level of 1200 MW of energy from Bioenergy of which: 300 MW is solid biofuels, 400 MW liquid biofuels, and the rest is biogas (Figure 15). 2022 has a level of 2000 MW, a major increase from 300 MW to 800 MW is recorded in the solid biofuels category: an increase of 72.72 MW/year
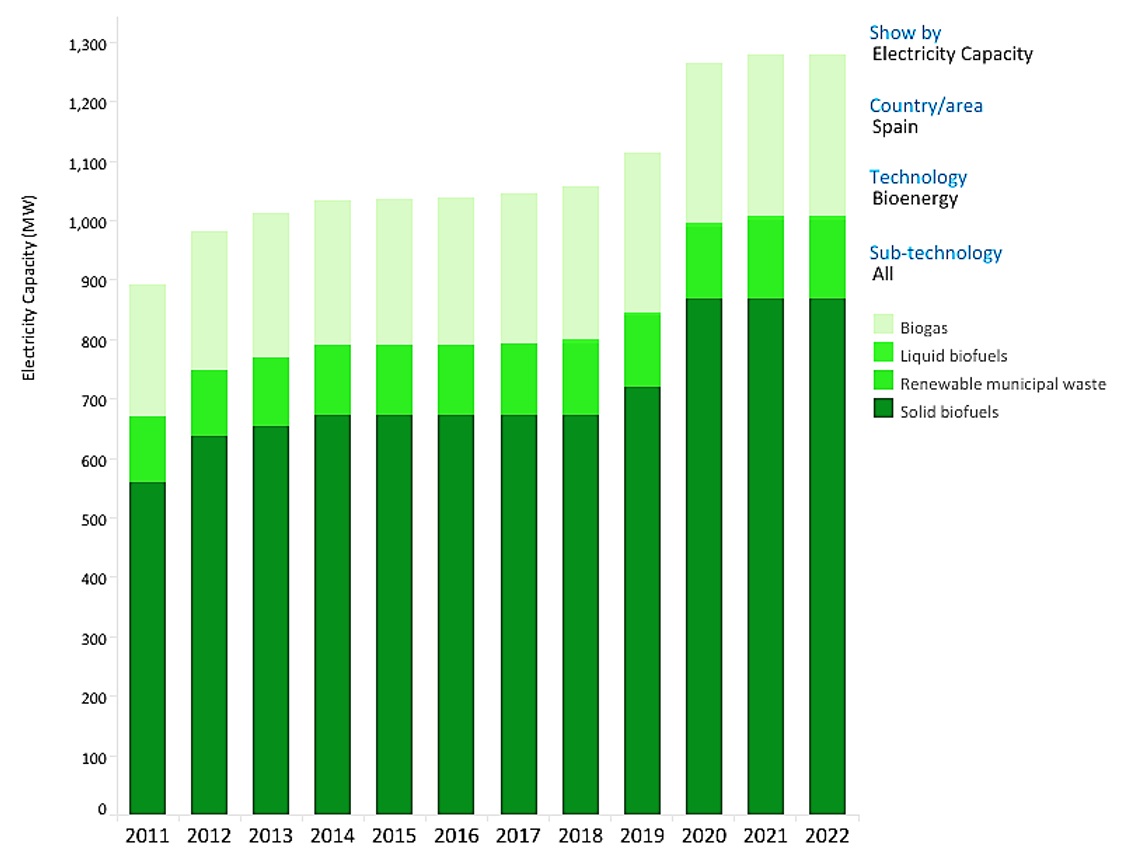
Spain: 2011 recorded a level of 900MW from Bioenergy of which: 550 MW solid biofuels, 100 liquid biofuels/renewable municipal waste, 300 MW biogas 2022 1300 MW energy from bioenergy an annual growth of 36.3 MW (Figure 16). A significant increase is recorded in the level of solid biofuels from 500 MW to over 700 MW.
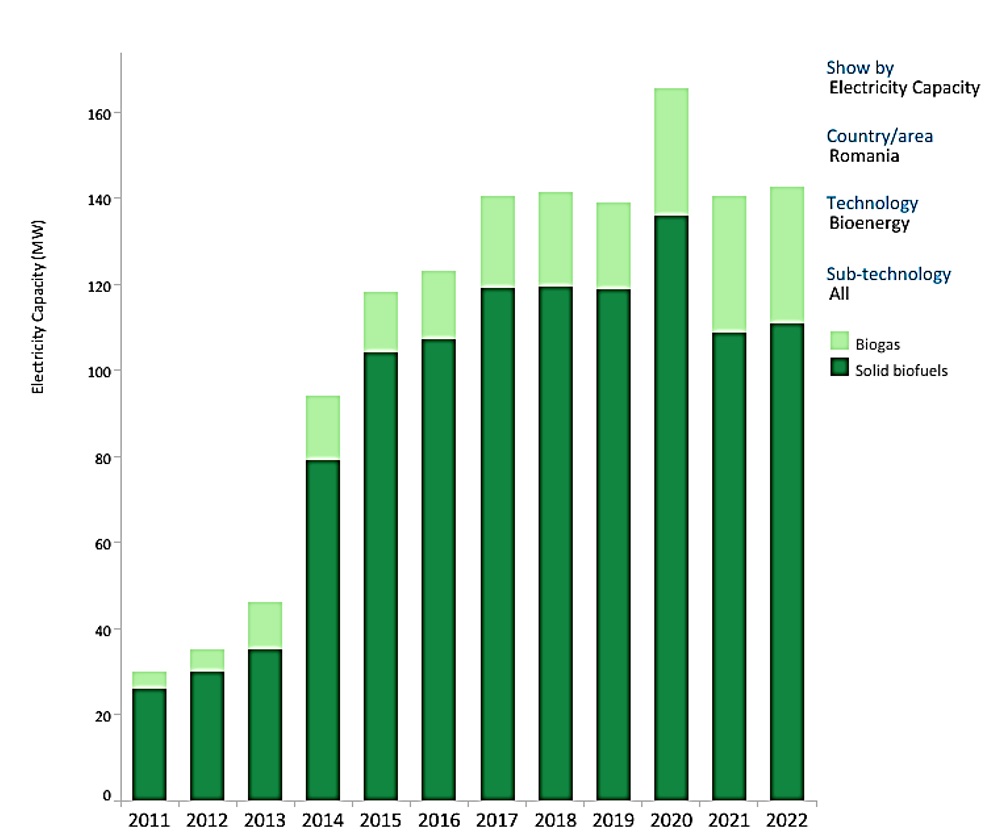
Romania: 2011 there is a value of 30 MW energy from Bioenergy of which 20 MW solid biofuels, 10 MW biogas (Figure 17). 2022, a value of 140 MW from bioenergy is recorded, an increase of 10 MW per year. A major increase from 20 MW to 115 MW is recorded in solid biofuels.
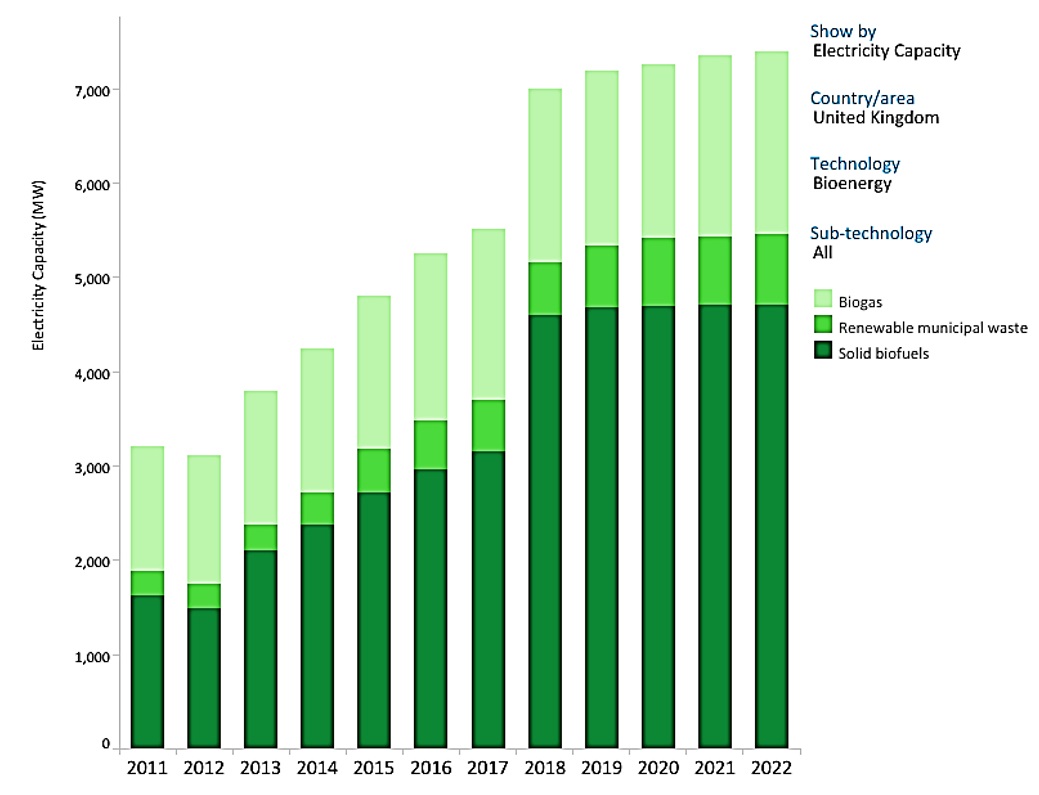
United Kingdom: 2011 a level of 3000 MW from Bioenergy almost 1800 MW from solid biofuels (Figure 18). In 2022 a level of 7000 MW from Bioenergy a yearly increase of 363.3 MW. A major increase is recorded at the level of solid biofuels from 1800 MW to 4000 MW.
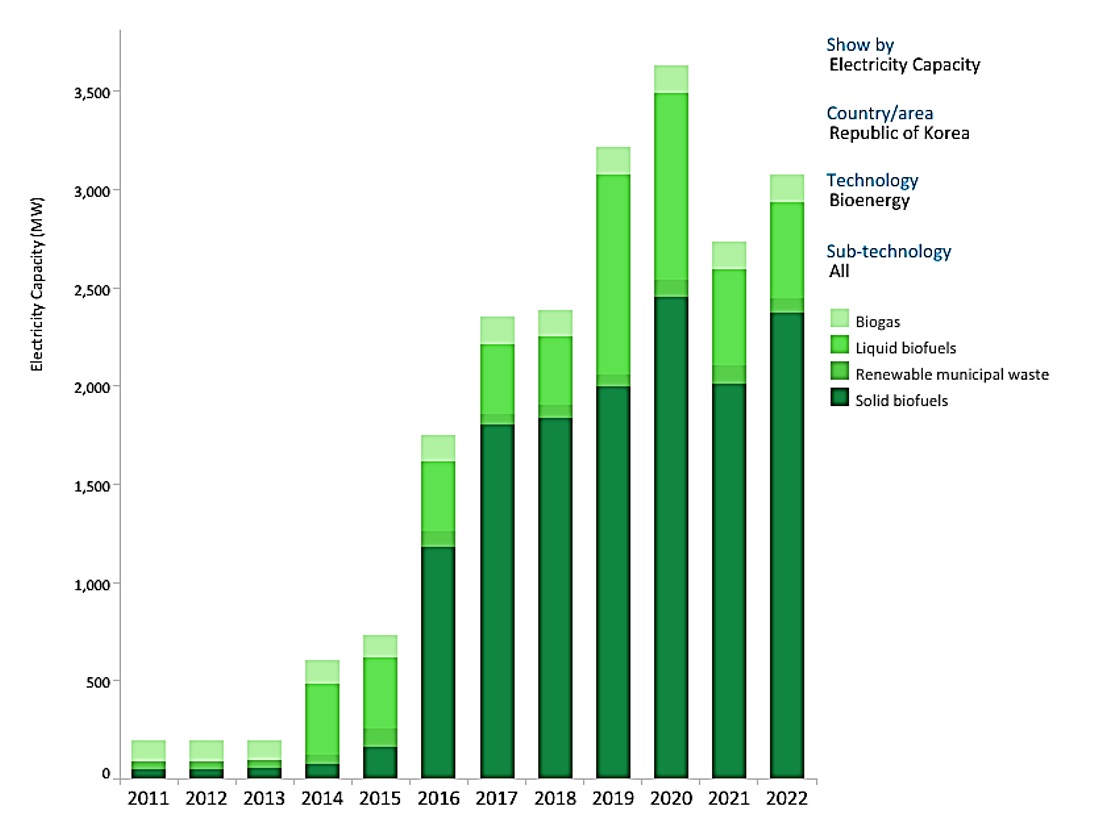
South Korea: South Korea shows a spectacular upward growth in Bioenergy uses from 100 MW in 2011 to 3000 MW in 2022 an increase of 263.63 MW/year (Figure 19). Upward growth in the period 2015-2020. It should be noted that in 2020 a level of 3500 MW was reached but due to the COVID-19 pandemic, there was a decrease.
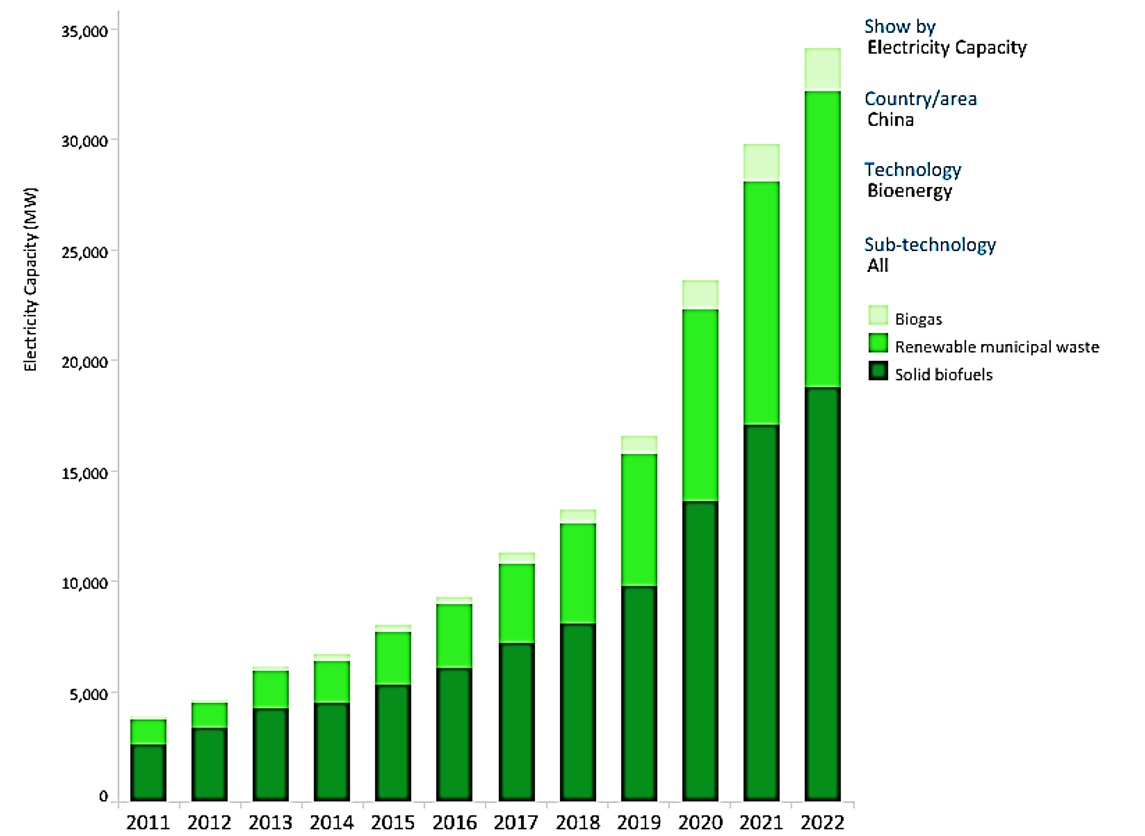
The People's Republic of China, as in all areas of activity, is experiencing spectacular growth in terms of MW from bioenergy, which was 5000 MW in 2011 and will reach 35000 MW in 2022. An annual increase of 2727 MW as seen in Figure 20.
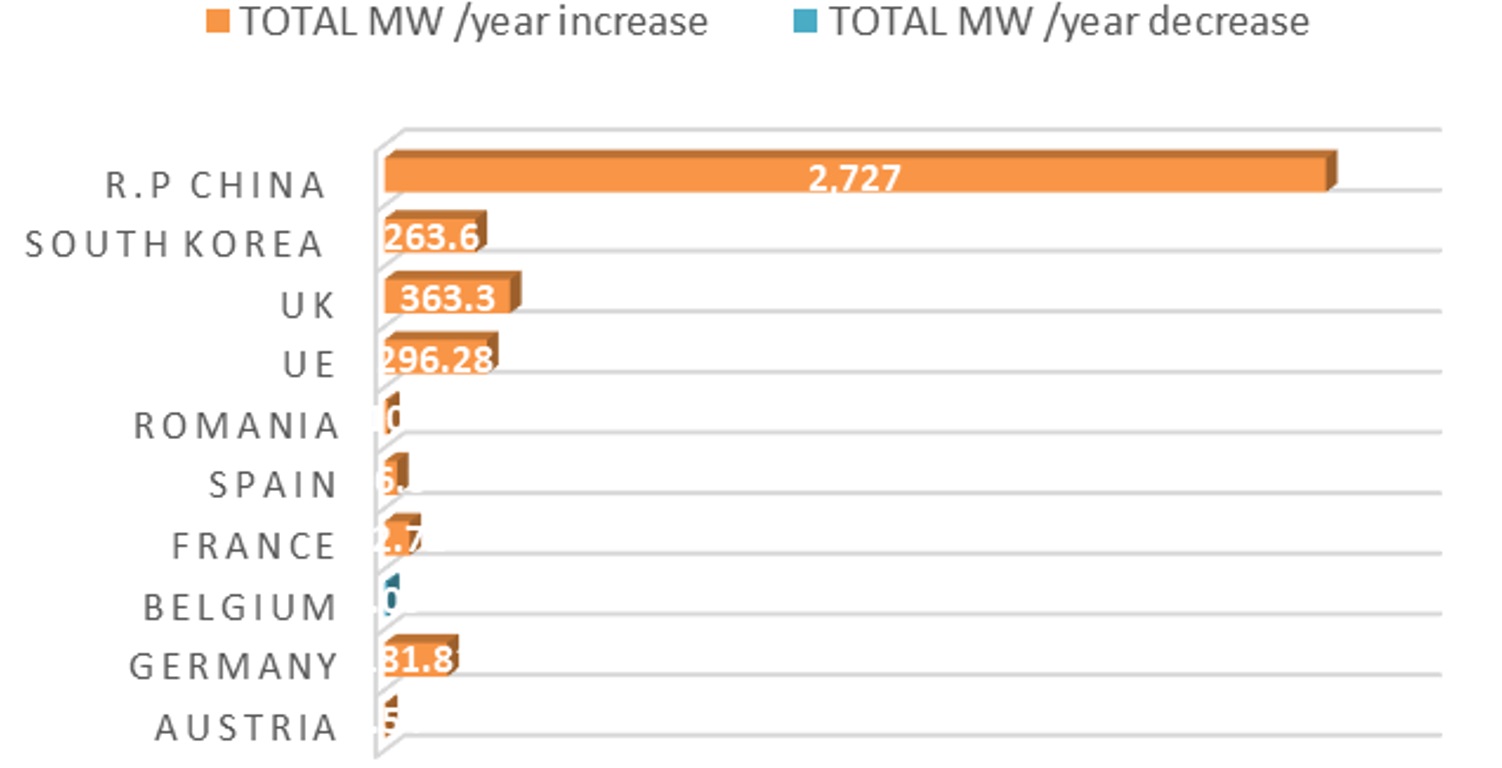
Following the research, a graph is made comparing the growth of MW from Bioenergy at the Geographical Axis level (Figure 21)
Analyses the proportion of the Asia-Europe geographical axis in increasing the share of renewable energy use and nationally determined contributions (NDCs) in country policies.
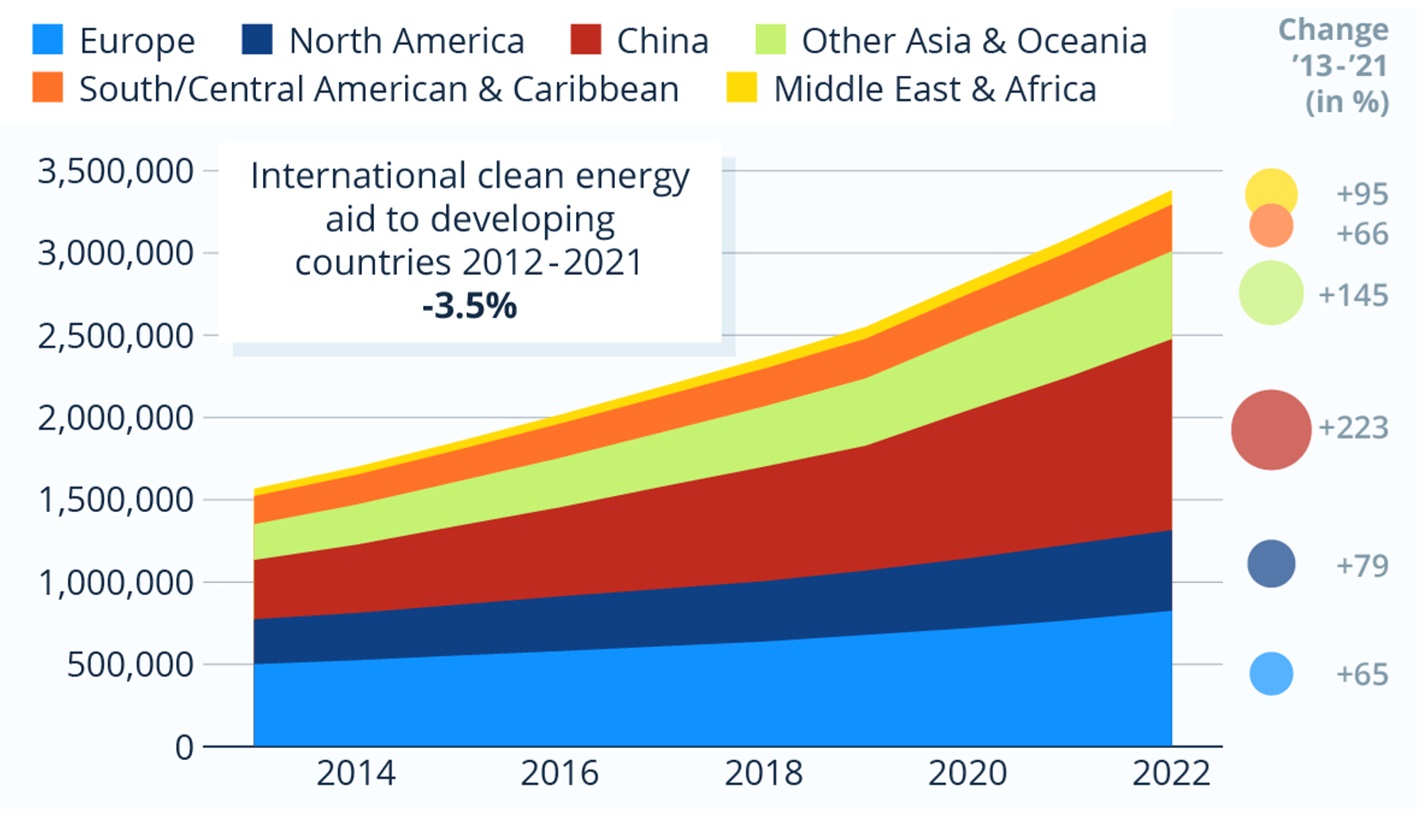
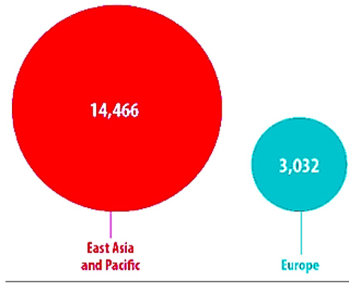
Renewable energy capacity around the world more than doubled in the 10 years between 2013 and 2022, a newly released report from the International Renewable Energy Agency has found. However, progress has been quite lopsided, with large capacities having been built up in Europe and huge progress, especially in the last decade happening in China (Figure 22).
Other regions, namely South and Central America as well as the Middle East and Africa, have neither large capacity already built nor have they experienced above-average growth over the specified period - creating the danger of being left behind in the global energy transition.
International financial aid to developing countries in support of clean energy research, development and production having been cut down in 2021 to below 2012 levels is certainly not helping this issue. Countries in Asia and Oceania other than China showed above-average growth of renewable energy as its capacity is now two-and-a-half times as big as it was in 2013. The region overtook North America in megawatts of renewable energy installed in the process, but given the continents' much larger population, it is safe to say that renewable energy progress in Asia has been relatively slower outside of China. The current progress in renewable energy installation means that in 2021, 27.8 % of the world's electricity was created via renewable sources.
This was only a slight 0.2 % increase over 2020 as non-renewable energy production—conversely also a speciality of China—picked up more speed once again. Considering not just electricity, but all energy sources in the world, renewables' share shrinks once more to just 8.0 % in 2022.
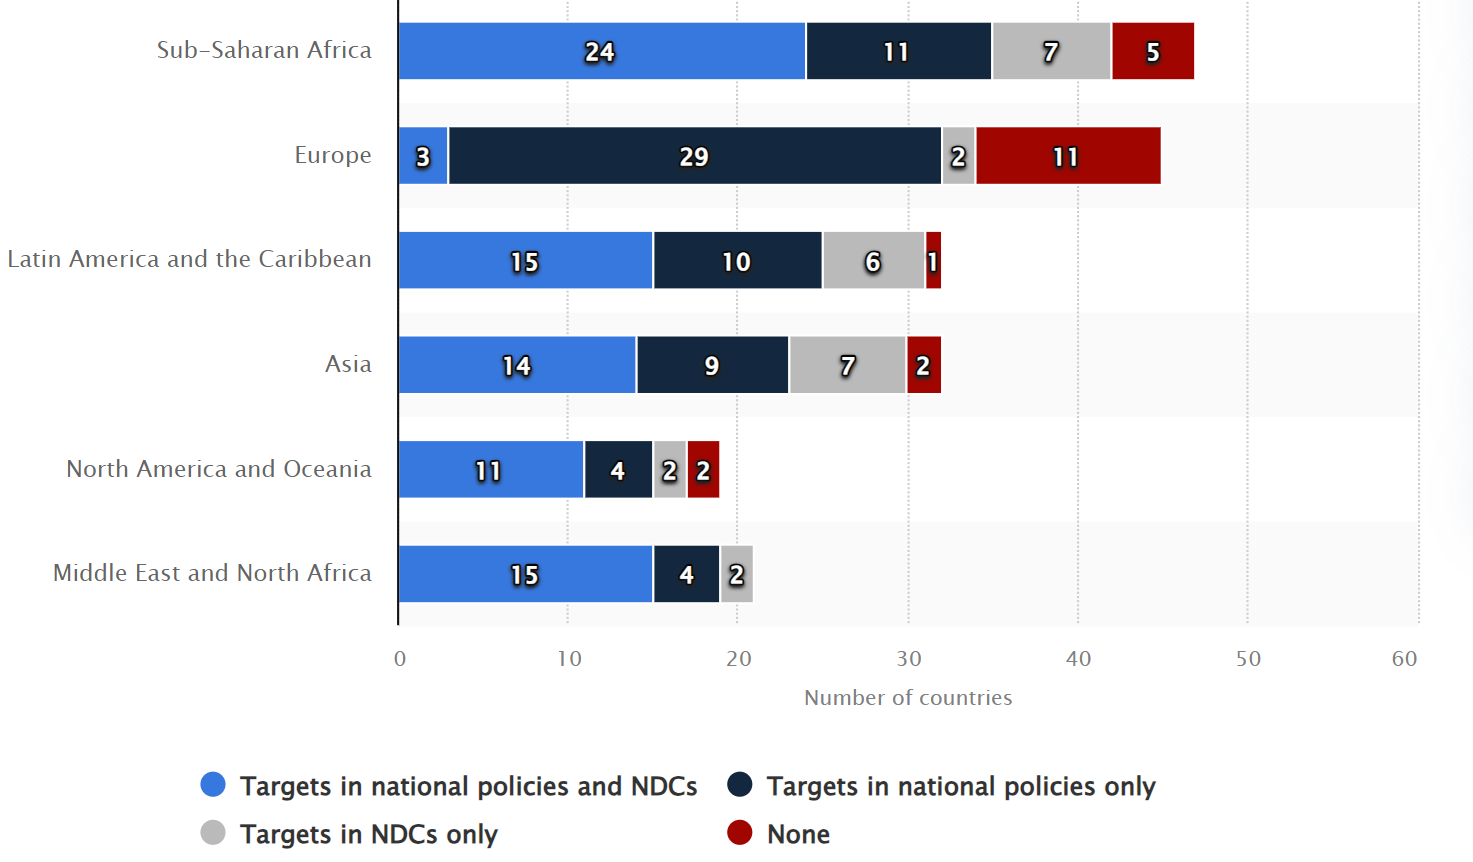
A total of 82 countries had set renewable power targets in both National Determined Contributions (NDCs) and national policies worldwide as of mid-October 2022. The Sub-Saharan region in Africa accounted for the largest number of targets both in NDCs and national policies. Meanwhile, Europe was the region with the most renewable power targets in national policies only (Figure 23).
As of November 2023 (COP28), around 145 countries had announced or are considering net zero targets, covering close to 90.0 % of global emissions. Among these are China, the EU, the USA, and India, which jointly represent more than half of global greenhouse gas emissions.
The EU’s climate neutrality - or, essentially, net zero GHG emissions – target is acceptable in terms of its architecture, transparency and scope, with a regular review and assessment process, a provision for the EU to set an intermediate target in 2040 following the Paris Agreement’s Global Stocktake, an exclusion of reductions or removals achieved outside of its territory, and clear analysis underpinning the target.
A clear separation of the contributions from emissions reductions versus removals is missing, although this is an element that is required of the forthcoming 2040 target.
The first assessment of the consistency of the EU’s climate policy and assessment of its progress towards its net zero target must be prepared by the Commission by 30 September 2023[12].
China committed to reaching “carbon neutrality” before 2060, confirming that only CO2 emissions are covered, but not all greenhouse gases. While researchers at Tsinghua University and China’s COP26 delegate Xie Zhenhua previously claimed that all greenhouse gases were covered by China’s net zero target, the LTS submitted has clarified that it covers CO. only: it has an explicit reference to ‘carbon neutrality’, it links to the 2030 carbon dioxide peaking NDC target, and has a separate discussion on non-CO. emissions[13].
France is the leader of the European Union in terms of economic importance and the main component of the axis of analysis. This analyses the distribution of primary energy production from renewable sources in France (Figure 24).
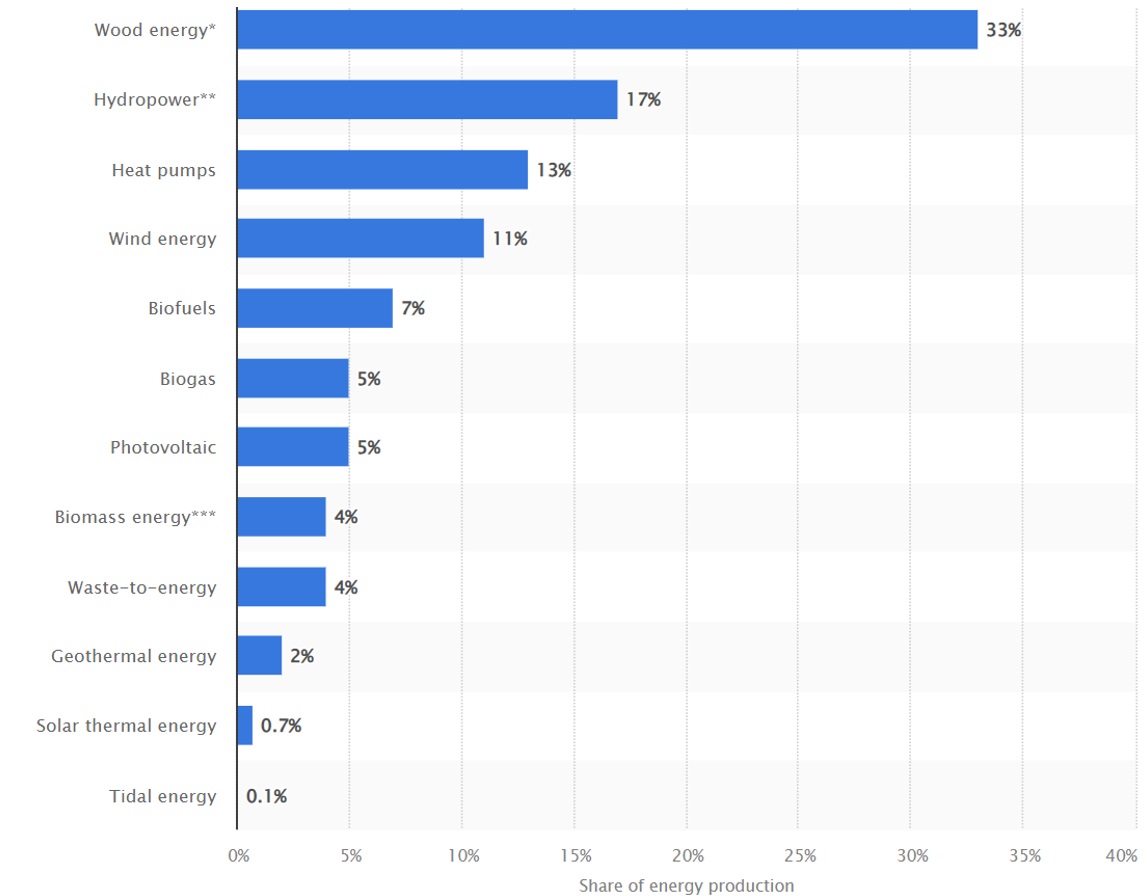
Wood energy accounted for the largest share of primary renewable energy produced at over 30.0 %. Hydropower was the second main source of renewable energy at some 20.0 % of the total. The primary energy production from renewable resources in France stood at 342.0 TWh in 2021[14].
France has made significant strides in shaping its budget to increase net-zero-aligned public finance. Since 2017, the country has committed to incorporating climate considerations into its annual budgetary process, resulting in the publication of the world's first "Green Budget" in 2021. This budget assesses the environmental impact of all state expenditures based on criteria such as climate, biodiversity and local air pollution.
Research shows that within the geographical axis, Asia has a higher share of renewable energy from hydropower than Europe (Figure 25)
Discussion
The geographical axis under investigation brings together the world's major economic powers . This research study analyses worldwide investments in renewable energy from 2004 to 2022, with a comparison over this period.
In 2022, the total new investment in renewable energy amounted to approximately 495 bn USD worldwide. This was a 17.0 % increase from the previous year.
The amount of funding provided for clean energy worldwide has steadily increased over the last two decades. In 2004, clean energy investments totalized 32 bn USD and increased to a peak of 495 bn USD in 2022. The significant increase in investment funding indicates that the industry has matured greatly. Policy support for renewable sources, an accelerating industry, and the emergence of publicly listed companies that own renewable energy assets (also known as yields) have driven the steady rise in clean energy investment.
The biggest mistake we can make is to take things for granted. Preparation is an action; it is the opposite of contentment. From the analysis we have carried out, we have identified the five key points that need attention and action now from European and national policymakers to seize the solar opportunity:
1. Growing the pool of certified solar installers and skilled workforce
2. Maintaining regulatory stability and investor certainty for solar and renewables
3. Enabling smoother integration of solar PV in the grid, especially on the distribution level
4. Improving spatial planning and permitting procedures for solar in harmony with people and nature
5. Ensuring sustainable and reliable solar PV supply chains
With climate change and the depletion of resources worldwide, decision-makers (government, private sector, academics) are promoting investments in green energy such as solar and wind energy.
There are many sources of renewable energy available these days, such as biomass and waste-to-energy, geothermal and marine. However, investment in solar and wind energy is by far the highest. Global investment in solar energy has soured since 2004, rising from just over 10 bn USD to more than 140 bn U$S in 2019[15].
The countries with the highest investment in renewable energy are China and the United States, with investment in the former amounting to 90 bn USD in 2019. However, this was a slight decrease from the previous year whilst investment in the United States experienced growth of 25 %.
Conclusions
The Asia-Europe geographical axis presents a large capacity for the use of green energy compared to the other regions. Energy is a requirement in our everyday life as a way of improving human development leading to economic growth and productivity. The return-to-renewables will help excellently mitigate climate change but need to be sustainable to ensure a sustainable future for generations to meet their energy needs. Knowledge regarding the interrelations between sustainable development and renewable energy is still limited.
The paper aimed to ascertain if renewable energy sources were sustainable and how a shift from fossil fuel-based energy sources to renewable energy sources would help reduce climate change and its impact. Qualitative research was employed by reviewing papers in the scope of the study. Even though, the complete lifecycle of renewable energy sources has no net emissions it will help limit future global greenhouse gas emissions. Nevertheless, the cost, price, political environment, and market conditions have become barriers preventing developing, least developed and developed countries from fully utilising their potential.
In this way, a creation of global opportunity through international cooperation that supports least developed and developing countries towards the accessibility of renewable energy, energy efficiency, clean energy technology and research and energy infrastructure investment will reduce the cost of renewable energy, eliminate barriers to energy efficiency (high discount rate) and promote new potentials towards climate change mitigation.
The Asia-Europe Geographical Axis is a model for green energy development. A model of the energy axis is outlined with the help of which it is possible to carry out programmes to promote the potential of renewable energies.
References
Abbasi, T., & Abbasi, S. (2010). Renewable energy sources: Their impact on global warming and pollution. PHI Learning.
Abbasi, T., Premalatha, M., & Abbasi, S. (2011). The return to renewables: Will it help in global warming control? Renewable and Sustainable Energy Reviews, 15, 891–894. http://dx.doi.org/10.1016/j.rser.2010.09.048
Ajanovic, A. (2011). Biofuels versus food production: Does biofuel production increase food prices? Energy, 36, 2070–2076. http://dx.doi.org/10.1016/j.energy.2010.05.019
Asumadu-Sarkodie, S., & Owusu, P. A. (2016a). A review of Ghana’s energy sector national energy statistics and policy framework. Cogent Engineering, 3. doi:10.1080/23311916.2016.1155274
Asumadu-Sarkodie, S., & Owusu, P. A. (2016b). The potential and economic viability of solar photovoltaic in Ghana. Energy Sources, Part A: Recovery, Utilization, and Environmental Effects. doi:10.1080/15567036.2015.1122682
Asumadu-Sarkodie, S., & Owusu, P. A. (2016c). Carbon dioxide emissions, GDP, energy use and population growth: A multivariate and causality analysis for Ghana, 1971–2013. Environmental Science and Pollution Research International. doi:10.1007/s11356-016-6511-x
Asumadu-Sarkodie, S., Owusu, P. A., & Jayaweera, H. M. (2015). Flood risk management in Ghana: A case study in Accra. Advances in Applied Science Research, 6, 196–201
Asumadu-Sarkodie, S., Owusu, P. A., & Rufangura, P. (2015). Impact analysis of flood in Accra, Ghana. Advances in Applied Science Research , 6 , 53–78
Baños, R., Manzano-Agugliaro, F., Montoya, F., Gil, C., Alcayde, A., & Gómez, J. (2011). Optimization methods applied to renewable and sustainable energy: A review. Renewable and Sustainable Energy Reviews, 15, 1753–1766. http://dx.doi.org/10.1016/j.rser.2010.12.008
Baum, S., Weih, M., Busch, G., Kroiher, F., & Bolte, A. (2009). The impact of short rotation coppice plantations on phylodiversity. Landbauforschung - vTI Agriculture and Forestry Research, 3, 163–170.
Brew-Hammond, A. (2010). Energy access in Africa: Challenges ahead. Energy Policy, 38, 2291–2301.10.1016/j.enpol.2009.12.016
Demirbas, M. F., Balat, M., & Balat, H. (2009). The potential contribution of biomass to sustainable energy development. Energy Conversion and Management, 50, 1746–176
Edenhofer, O., Pichs-Madruga, R., Sokona, Y., Seyboth, K., Matschoss, P., Kadner, S., von Stechow, C. (2011). Renewable Energy Sources and Climate Change Mitigation. Cambridge: Cambridge University Press. http://dx.doi.org/10.1017/CBO9781139151153
EEA. (2016). Mitigating climate change, greenhouse gas emissions. Retrieved from http://www.eea. Europa.eu/sour-2015/countries-comparison/ climate-change-mitigation
Førsund, F. R. (2015). Hydropower economics (Vol. 217). New York: Springer.
Fräss-Ehrfeld, C. (2009). Renewable energy sources: A chance to combat climate change (Vol 1). Kluwer Law International.
Gnanasekaran, L., Priya, A.K., Thanigaivel, S., Hoang, T. K.A., Soto-Moscoso, M. (2023) The conversion of biomass to fuels via cutting-edge technologies: Explorations from natural utilization systems, Fuel, 331 Fuel, Part 1, 125668. https://doi.org/10.1016/j.fuel.2022.125668
Hák, T., Janoušková, S., & Moldan, B. (2016). Sustainable development goals: A need for relevant indicators. Ecological Indicators, 60, 565–573. http://dx.doi.org/10.1016/j.ecolind.2015.08.003
Hamann, A. (2015). Coordinated predictive control of a hydropower cascade.
Headey, D. & Fan, S. (2008). Anatomy of a crisis: The causes and consequences of surging food prices. Agricultural Economics, 39, 375–391. http://dx.doi.org/10.1111/agec.2008.39.issue-s1
Hoogwijk, M., Faaij, A., Eickhout, B., de Vries, B., & Turkenburg, W. (2005). The potential of biomass energy out to 2100, for four IPCC SRES land-use scenarios. Biomass and Bioenergy, 29, 225–257.. http://dx.doi.org/10.1016/j.biombioe.2005.05.002
Kaygusuz, K. (2012). Energy for sustainable development: A case of developing countries. Renewable and Sustainable Energy Reviews, 16, 1116–1126. http://dx.doi.org/10.1016/j.rser.2011.11.013
Koh, L. P., & Ghazoul, J. (2008). Biofuels, biodiversity, and people: Understanding the conflicts and finding opportunities. Biological Conservation, 141, 2450–2460. http://dx.doi.org/10.1016/j.biocon.2008.08.005
Kruyt, B., van Vuuren, D. P., de Vries, H., & Groenenberg, H. (2009). Indicators for energy security. Energy Policy, 37, 2166–2181. http://dx.doi.org/10.1016/j.enpol.2009.02.006
Larsen, H. H., Kristensen, N. B., Sønderberg Petersen, L., Kristensen H. O. H., Pedersen, A. S., Jensen, T. C., & Schramm, J. (2009, March 17-18). How do we convert the transport sector to renewable energy and improve the sector’s interplay with the energy system? Background paper for the workshop on transport-renewable energy in the transport sector and planning, Technical University of Denmark. Technical University of Denmark
Lu, Y., Nakicenovic, N., Visbeck, M., & Stevance, A.-S. (2015). Policy: Five priorities for the UN sustainable development goals. Nature, 520, 432–433. http://dx.doi.org/10.1038/520432a
Manwell, J. F., McGowan, J. G., & Rogers, A. L. (2010). Wind energy explained: Theory, design, and application. Wiley.
Maugeri, L. (2006), The Age of Oil: The Mythology, History, and Future of the World's Most Controversial Resource. pp. 136,142.
Nersesian, R.L.(2014) Energy for the 21st Century: A Comprehensive Guide to Conventional and Alternative Sources. pp. 147.
Owusu, P. A., Asumadu-Sarkodie, S., & Ameyo, P. (2016). A review of Ghana’s water resource management and the prospect. Cogent Engineering, 3. http://doi:10.1080/23311916.2016.1164275
Panwar, N., Kaushik, S., & Kothari, S. (2011). Role of renewable energy sources in environmental protection: A review. Renewable and Sustainable Energy Reviews, 15, 1513–1524. http://dx.doi.org/10.1016/j.rser.2010.11.037
Rosalind Archer (2020), 20 - Geothermal Energy, Future Energy (Third Edition), Improved, Sustainable and Clean Options for our Planet, p . 431-445 doi.org/10.1016/B978-0-08-102886-5.00020-7
Schulz, U., Brauner, O., & Gruß, H. (2009). Animal diversity on short-rotation coppices–a review. Landbauforschung - vTI VTI Agriculture and Forestry Research, 3, 171–181.
Su; W.H., Liu, M.L., Zeng, S.Z., Streimikiene, D., Balezentis, T., Ališauskaitė-Šeškienė. I. (2018) Valuating renewable microgeneration technologies in Lithuania households. Journal of Cleaner Production, 191, 318-329, https://doi.org/10.1016/j.jclepro.2018.04.199
Tester, J.W., Drake, E.M., Driscoll, M.J., Golay, M.W. and Peters, W.A. (2005) Sustainable Energy: Choosing among Options. MIT Press, Cambridge.
Tiwari, G. N. , & Mishra, R. K. (2011). Advanced renewable energy sources . Royal Society of Chemistry
Toth, F. L. & Rogner, H.H, (2006). Oil and nuclear power: Past, present, and future, Energy Economics, 28(1), 1-25. https://doi.org/10.1016/j.eneco.2005.03.004.
Twidell, J., & Weir, T. (2015). Renewable Energy Resources (3rd ed.). Routledge. https://doi.org/10.4324/9781315766416
Urban, F., & Mitchell, T. (2011). Climate change, disasters and electricity generation.
Verbruggen, A., Fischedick, M., Moomaw, W., Weir, T., Nadaï, A., Nilsson, L. J., Sathaye, J. (2010). Renewable energy costs, potentials, barriers: Conceptual issues. Energy Policy, 38, 850–861.10.1016/j.enpol.2009.10.036
World Energy Council. (2013). World Energy Resources: Hydro. Retrieved January 26, 2016, from https:// www.worldenergy.org/wp-content/uploads/2013/10/ WER_2013_5_Hydro.pdf
https://www.eea.europa.eu/ (accessed on 13.03.2023)
https://www.mordorintelligence.com/ (accessed on 13.03.2023)
https://www.iea.org/ (accessed on 13.03.2023)
https://climateactiontracker.org/countries/china/ (accessed on 13.03.2023)
https://www.statista.com/chart/31091/renewable-energy-capacity-by-region/ (accessed on 20.10.2023)
https://www.irena.org/Energy-Transition/Technology (accessed on 22.10.2023)
https://www.statista.com/statistics/1200658 (accesed on 22.12.2023)
https://ember-climate.org/topics (accesed on 22.12.2023)
Notes

