

Geografía Urbana
Human involvement with the rise of artificial intelligence in the realm of Geospatial Health
La participación humana con el auge de la inteligencia artificial en el ámbito de la Salud Geoespacial
Boletín Geográfico
Universidad Nacional del Comahue, Argentina
ISSN: 0326-1735
ISSN-e: 2313-903X
Periodicity: Semestral
vol. 45, 2023
Received: 12 September 2022
Accepted: 16 October 2023

Resumen:
En el mundo de la Web 3, las monedas digitales y las ciudades virtuales, las decisiones humanas son muy especiales. De hecho, es muy importante explicar la respuesta humana y la inteligencia artificial en el campo de la salud después de un evento y crear un sistema geográfico colaborativo basado en tecnología moderna para que este proceso conduzca al restablecimiento de servicios esenciales con prioridad de salud pública en un país. En esta investigación, se realizaron preguntas espaciales de acuerdo con la opinión pública, los actores interesados y los tomadores de decisiones en diferentes condiciones mentales y emocionales. Además, se utilizaron dos métodos estadísticos y de clasificación diferentes para comprender la extrañeza de las condiciones mentales de las personas en el entorno matemático. Todos los métodos mencionados fueron realizados mediante el software diseñado para la toma de decisiones de ubicación en igualdad de condiciones. Se investigó una región como ejemplo que puede generalizarse a un país e incluso a una escala mayor. Los resultados muestran que los factores tiempo están completamente relacionados con los criterios de decisión. Usar tecnologías emergentes es genial, pero dejar que la inteligencia artificial tome decisiones es completamente incorrecto. El hombre vive de sus elecciones para tomar decisiones, por lo tanto, utiliza todos los criterios relevantes en la toma de decisiones espaciales. Este estudio pionero, muestra que los humanos pueden tomar decisiones óptimas en diferentes situaciones según las mismas condiciones. Pero la inteligencia artificial sólo toma decisiones lógicas que no son compatibles con la mentalidad humana. La continuación de esta investigación presenta un valor potencial para ser utilizada por neurólogos o especialistas en salud mental enfatizando la importancia de las ciencias geográficas en el desarrollo urbano. Quizás sea posible resolver problemas y eventos médicos con inteligencia artificial, pero pareciera que al menos durante las próximas décadas, incluso con la aparición y continuidad de la inteligencia artificial, no será posible tomar decisiones en el ámbito de la salud sin la presencia de los humanos.
Palabras clave: NPGIS, Participación Geoespacial, Inteligencia artificial, Tecnología geográfica, Salud.
Abstract:
In the era of Web 3, digital currencies and virtual cities, human decision-making is very special. In It´s crucial to examine human responses alongside artificial intelligence in the healthcare field following an event and to create a collaborative geographic system based on modern technology. The ultimate goal is the restoration of countries´ essential services prioritizing health. In this research, spatial questions were conducted by considering public opinion, stakeholders, and decision makers under varying mental and emotional conditions. additionally, two different statistical and ranking methods were employed to comprehend the intricacies of individuals' mental states in a mathematical environment. All these methods were executed using software designed for location-based decision making under equal conditions. This paper focuses on a specific region, as an example applicable to a country or even to a larger scale. The results showed that time factors are completely related to decision criteria. While emerging technologies are promising, complete reliance on artificial intelligence for decision-making is misguided. Human choices are intrinsic to decision-making, and therefore, all relevant criteria for spatial decision-making have been considered. This pioneering study, conducted for the first time, showed that human choices can be optimal in different situations with similar conditions. Meanwhile, artificial intelligence only makes logical decisions that are not compatible with human thinking. The ongoing research holds potential value for neurologists or mental health specialists emphasizing the significance of geographical sciences in urban development. While it´s conceivable that medical issues and events can be addressed with artificial intelligence it appears that at least for the next few decades, even with the advancement of artificial intelligence, human presence remains essential in healthcare decision-making.
Keywords: NPGIS, Geospatial Participation, Artificial Intelligence, Geographical Technology, Health.
Introduction
Participation is a highly practical subject, and its significance depends on time. Time, indeed, is an effective factor in participation. The concept of time has been approached from various angles. In our perspective, individuals perceive time according to their unique outlooks, as what might seem excessive to one could appear too little for another. Consequently, passing judgment on time is unnecessary, as time itself acts as the ultimate judge. However, this viewpoint also represents a perspective on time, since decisions are always made within a specific timeframe.
In general, individuals take on various roles as judges, observers, managers, and decision-makers, each adopting their own standpoint. This is when the concept of partnership comes into play. Participation is a captivating subject that embraces all perspectives. On the other hand, one may not necessarily accept or reject a particular viewpoint. But participation where a viewpoint or thought can make it meaningful or impressionable, amplifies the allure of participation
Decision-making with public participation is a crucial component in all processes. Furthermore, when harmonized with the synchronization of events and the comprehensive understanding of projects from inception to conclusion, it forms the basis for the compilation of this article. Today, in the comprehensive planning and development of cities, significant and intricate decisions are mandatory for every community, local government or municipality. In this context, it is worth noting that making optimal decisions by integrating and combining a set of emerging phenomena such as the geographic information system (GIS) (itself a product of participation), has played a substantial role in the flourishing of knowledge and information (Valánszki et al., 2022; Johnson, Adams, Byrne & Harris, 2022).
Living in a world without a desk might be challenging but managing a world without time seems remarkably disastrous. The notion that time does not exist is inconceivable to many: time must exist. Nearly all our experiences confirm this belief (Baron, Miller, & Tallant, 2022).
In recent decades, the most important global trends, namely "urbanization", "sustainable development" and the "information and communication technology revolution", have had the most profound impact on human societies. It can be asserted that the shift of cities toward sustainable development, along with the growing role of information and communication technology in decision-making and urban management, have transformed the city administration system. While environmental, social and economic sustainability were emphasized in discourse in the 1980s, the 1990s, spotlighted the concept of a smart city, but today the focus has shifted to "sustainable smart cities" (Silva, 2013a)
In fact, open-source urban governance represents a novel approach to engage citizen participation: often referred to as electronic participation, remote democracy, information technology democracy, electronic consultation, web-based citizenship, online public administration, etc, (Silva, 2013b).
The central focus of urban activities is collaborative development, encompassing planning, design, and the implementation urban services based on electronic infrastructure, E-services involve change in services as well as socio-technological change and they relate to changes in participation methods (Wessels, 2010).
Studies related to participation in geographical context show the significant role of GIS, which may vary over time. Regarding collaborative geographic information system, it is worth noting that different authors use various abbreviations in their research. Some employ the abbreviation PPGIS, while others use PGIS. Occasionally these terms are used interchangeably within the same study, and sometimes, there exists differentiation between both. In line with this issue, a study entitled "Political Rethinking: Political Rethinking after GIS or PGIS" significantly, altered discourse´s essence. Therefore, debating whether PGIS or PPGIS is more accurate detracts from the primary objective, involving a relatively inconsequential matter. Such debates deviate from the main goal and undermine a system, designed to empower marginalized groups, due to their historical nomenclature (Dunn, 2007; Radil & Anderson, 2018).
Today, comprehensive planning and development of cities, needs critical and intricate decisions for every community, government or municipality. It is noteworthy that the pursuit of optimal decisions through the integration and synergy of emerging phenomena, such as the Geographic Information System (GIS), which is, in itself, a product of participation, has significantly enriched our knowledge and information (Valánszki et al, 2022; Johnson et al, 2022).
NPGIS (National Participation Geospatial Information System) made its initial appearance in 2022 through Fallah´s scientific doctoral dissertation (Fallah, 2022) and was subsequently published in Fallah, Karami & Kojouri, (2022a) and Fallah, Karami & Kojouri (2022b). The accessibility of information in terms of time and place holds significant importance, especially when it is required. Despite the remarkable evolution of GIS in recent decades, it remains crucial to consider how geographic information can effectively operate in the era of information technology.
Does the idea of a world where facts lose their meaning provoke anxiety, fear or even paranoia? Disinformation: The Nature of Facts and Lies in the Post-Truth Era may not remedy all the challenges of a post-truth world, However, by illustrating how the integration of digital technology into everyday life has interconnected various seemingly disparate factors–historical, psychological, economic, and cultural –to create the post-truth culture. Disinformation aids in comprehending how we arrived at our current state, seeing how we can move beyond a culture where facts are easily dismissed, and develop a few highly practical skills for distinguishing truth from lies (Greene, 2022).
The initial stage of the study in this trajectory involves outlining the objectives and intended outcomes while acquiring explicit spatial data, ideally in collaboration with stakeholders. Data collection primarily revolves around the examination of web-based maps. Typically, participants complete individual surveys, often with the guidance of a facilitator or a decision-maker (Fagerholm, García-Martín, Torralba, Bieling & Plieninger, 2022).
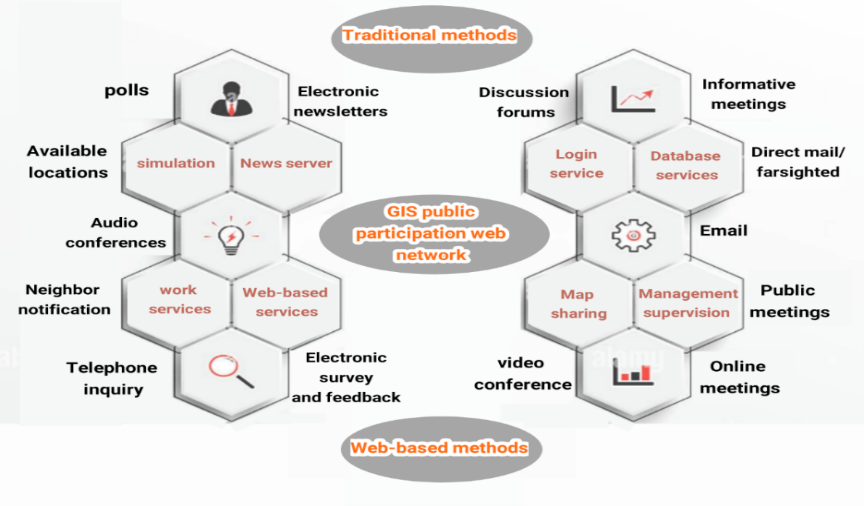
Public participation in the development of a large-scale or small-scale municipal plan serves specific objectives, such as streamlining the planning process, facilitating the exchange or dissemination of ideas and supporting the decision-making process. Traditional methods, of public participation in urban planning and management include neighborhood notifications, interviews, exhibitions, public meetings and focus group discussions, and public inquiries via telephone, e-mail, teleconference, or public meetings (Lewenstein, 2022).
Given the aforementioned instances, environmental conditions, crises and lack of planning significantly influence decision-making. In this context, several important questions arise. 1)- Do geographical sciences interact with the public health of a region? 2)- Is it conceivable that artificial intelligence (AI) may eventually replace medical sciences in the forthcoming decades? 3)- What is the determining criterion in collaborative decision-making? Based on these important questions, the researchers propose the following hypotheses: 1)- There exists a relationship between geographical sciences and public health of a region. 2)- It is plausible that AI could potentially supplant medical sciences in the coming and 3)- There is a significant relationship between time factors and collaborative decision-making.
Based on the opinion of the researchers, the success resulting from the planning, design and deployment of the spatial information system based on national participation effectively increases the level of public effectiveness. Provided that it is in sync with the support of such decision-making in the course of urban planning and management. Such guidance mainly depends on an understanding of society, as illustrated in Figure 1, which combines traditional and new web-based forms of participation.
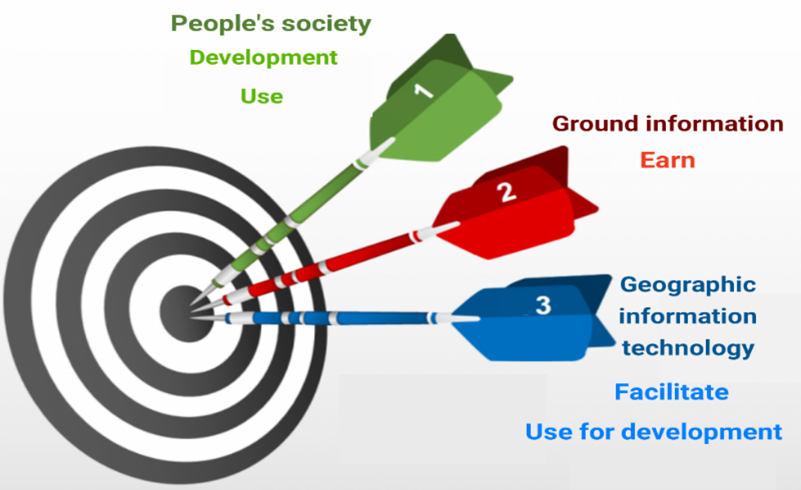
In fact, this novel form of information is derived from location-based technology along with geographic information systems making it easily accessible to a wide range of users. These users include the general public, developers, decision-making authorities and researchers involved in group decision-making processes, which, naturally provides special and notable assistance. Figure 2 illustrates the central concept of contemporary geographic communication
Research literature review
Considering the absence of a study like the current one, it is necessary to use the themes of participation, space-time-place, philosophical geography and GIS technology. When discussing participation, it is essential not to overlook Arnstein's elementary ladder and her prior discussions (Arnstein, 1969). Despite the remarkable evolution of GIS over recent decades, the understanding of spatial information has remained largely consistent, even as diverse GIS methodologies are applied. Incorporating geographical aspects such as neighborhoods, cities, and regions can often be seen as venturing to exploring uncharted territory. Currently, limiting the term "place" to an external realm is meaningless, as 80% of people's daily lives are spent indoors (Teixeira et al, 2021).
Over the past decade, the use of collaborative geographic information system has seen a significant rise in urban sciences topics. This system is built upon various knowledge domains, including critical mapping, collaborative methods. Development-oriented and ideal cities are connected with optimal urban planning, civil governance, community development, resource management, environmental and natural hazards, reaching a smart city, etc. This approach, in addition to the necessity for a platform for civil and political interaction and participation, requires spatial information system specialists to guide its operation towards the core concerns of local management, such as optimal service delivery, spatial justice, and politics (Indrajit, Van Loenen & Van Oosterom, 2019; Prener, 2021).
Embracing participation as a legitimate political approach and process, grounded in the belief in people´s roles in the development process, significantly fosters the production and utilization of participation-related information, including participatory data and spatial information. This trend provides the grounds for harnessing exceptional capabilities that emerge from the integration of the geographic information system capacities with innovations in the field of information and communication technology as well as new approaches rooted on electronic and online participation (Ghose, 2017;Anderson & Radil, 2019), for leveraging GIS to foster civic engagement and participation among segments of the population historically excluded from formal governance arenas. This perspective underscores the political outcomes over social opinions (Anderson & Sternberg, 2012; Sternberg & Anderson, 2014).
Hence, this area has evolved into a fitting realm for urban research in the domains of participation and electronic governance. Solving any crisis necessitates a series of solutions and meticulous planning. These solutions encompass a set of operations executed by governmental, private, and public organizations when confronted with a crisis, with the aim of mitigating damage, minimizing waste, restoring normalcy, and reverting to the pre-crisis state.
Background research
Evaluation of the collaborative mapping effort, as an indicator of spatial data quality, reveals that the facilitated collaborative spatial information system process yields superior results in map production than individual surveys. The collaborative mapping effort within the sampling group aims to streamline the visualization of the largest dimensions. The number of markers and response time in the effort range aligns with findings from other studies on public contributions in participatory GIS (Brown, 2016b).
A 2017 study in a developing country, Malaysia, shown that participants could match place values and place preferences with current land uses, suggesting that a non-expert in Malaysia can interpret digital maps proficiently. This approach serves bridge the knowledge gap with experts by establishing local knowledge about the place. While the newness of PGIS in Malaysia as a participatory method can stimulate public participation fostering a more robust culture of participation for land use planning requires sustained effort over time (Zolkafli, Liu & Brown, 2017).
In 2019, the Ushahidi project introduced dedicated maps for disaster response in cities. presenting the potential to become as a foundational model in the international community. The creation of a collaborative geographic information system in emergency situations can easily prevent major disasters, as further discussed in this study (Ushahidi H.P.E, 2011; Haiti Situation Report, 2019;Haiti Projects, 2019).
It's essential to note that in the preceding two examples, a lack of attention to the timing of incidents, weak crisis management, and incomplete familiarity with real-time information repositories contribute to the inability of urban organizations to make decisions. Another noteworthy point is the 2022 summer Haiti earthquake. Approximately eleven years after a devastating earthquake, Haiti experienced a similar, if not more severe, seismic event. The United States Geological Survey (USGS) reported a magnitude 7.7 earthquake off the coast of Port-au-Prince, the capital of Haiti, resulting in approximately 1500 casualties.
According to his statement, the aid was mostly concentrated in the southwestern regions of the country, which have suffered heavy losses due to the earthquake. Around 7,000 individuals have been injured, and many others remained unaccounted for. This earthquake prompted many Haitians to sleep outdoors, fearing aftershocks and due to damaged or destroyed homes. For the people of Haiti, this event brought back painful memories of the 2010 magnitude 7 earthquake, which claimed the lives of over 300,000 people. The 2010 earthquake also left 1.5 million Haitians homeless (CDMA, 2022).
Additionally, challenges have arisen from issues such as the improper disposal of waste by relief organizations. Establishing predefined response times can aid in addressing and mitigating such problems. Research by Aeon, Faber and Panaccio (2021) underscores the significance of time management in personal performance, well-being, job performance, academic progress, and general health. Time management exhibits a moderate and negative association with personal stress or distress, further highlighting its impact on people's overall well-being, and this relationship is unrelated to gender.
Study Area
In recent times, there has been tremendous growth in machine learning research and its applications in many domains (Aqib et al, 2022). Nowadays, modeling and visualization of 3D models and programming for cities is a big challenge in computer and graphics software. Recently, 3Durban modeling has grown due to the advancement in applications along with the storm of information technology revolution. These technologies have become very important in representing large cities and performing various analyzes in the virtual environment of cities and to support urban decision-making (Badwi, Ellaithy, & Youssef, 2022).
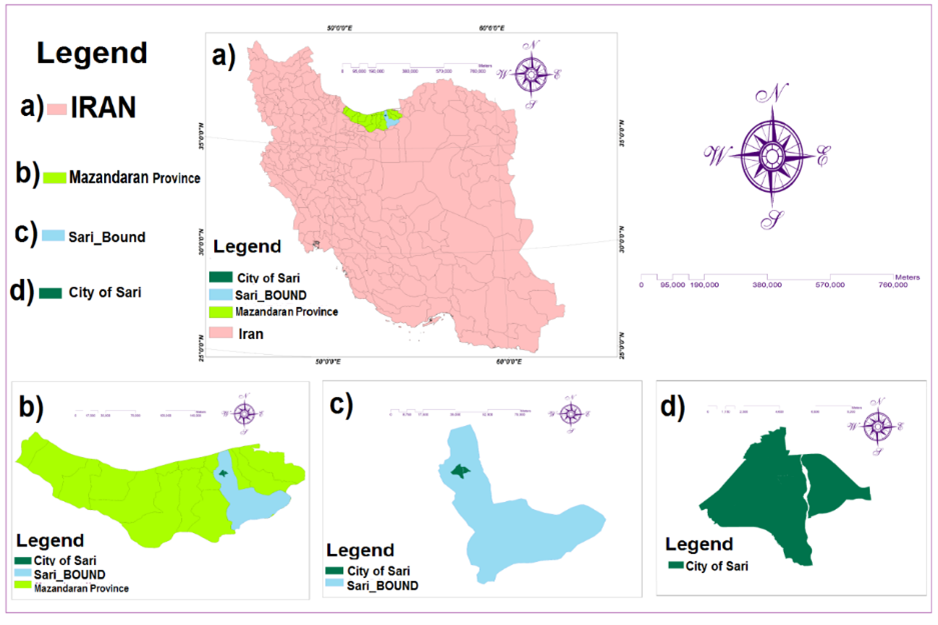
The area under investigation in this research was limited to assessing this method in response to the new participation framework enabled by the development and utilization of software. Consequently, its applicability can be extended to various other domains. Sari, a city situated in the northern Mazandaran province of Iran, was the former capital of the nation before Tehran. Sari holds a prominent place in Iran's history and boasts a moderate climate. Its geographic coordinates are approximately 36°33'48" north latitude and 53°03'36" east longitude, with a population of around 347,402 inhabitants (Isfandiyār, 1905), (Statistical Yearbook of Iran, 2018). Figure 3 displays the location of Sari city within the broader context of a) Iran, b) Mazandaran province, and c) the Sari district.
Methods and data
Data
Every day and night is divided into twenty-four hours, but it's important to note that the length of a day or night, such as solar or astronomical, doesn't always equate to exactly twenty-four hours. The duration of days throughout the year can vary, either increasing or decreasing by a few minutes. In practical agreements among the public, to avoid inconsistencies and discrepancies, all days and nights are conventionally treated as twenty-four hours. Time measurements have captivated the minds of many scholars and technologists. Events and alternating movements during different times have been used as standard units of time. For example, we can refer to the movement of the sun in the sky, the phases of the moon, and the heartbeat or pulse. Presently, the standard unit for measuring time is the second, defined based on the measurement of electron transitions within the cesium atom, element 55 of the periodic table. Time has profound social importance and due to its constraints within day and night and human lifespan, it carries distinct economic and personal value (McAllister, 2019; Builes, 2021; Malpass, 2021).
Artificial intelligence is widely used and continuously developed by humans. The interesting thing is that most people find this field quite satisfying. The ability to accomplish tasks more swiftly brings joy to people. The desire to use it has increased dramatically these days. AI and software development based on participation have also been used in this project. Additionally, computer software has been used to rank the criteria and statistical scores, and almost the intricate calculations that were supposed to be done by humans have been done by computer software easily and in a short period of time.
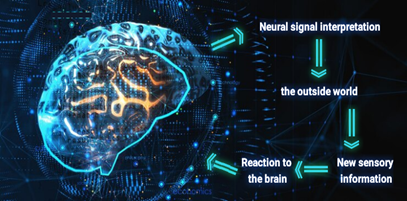
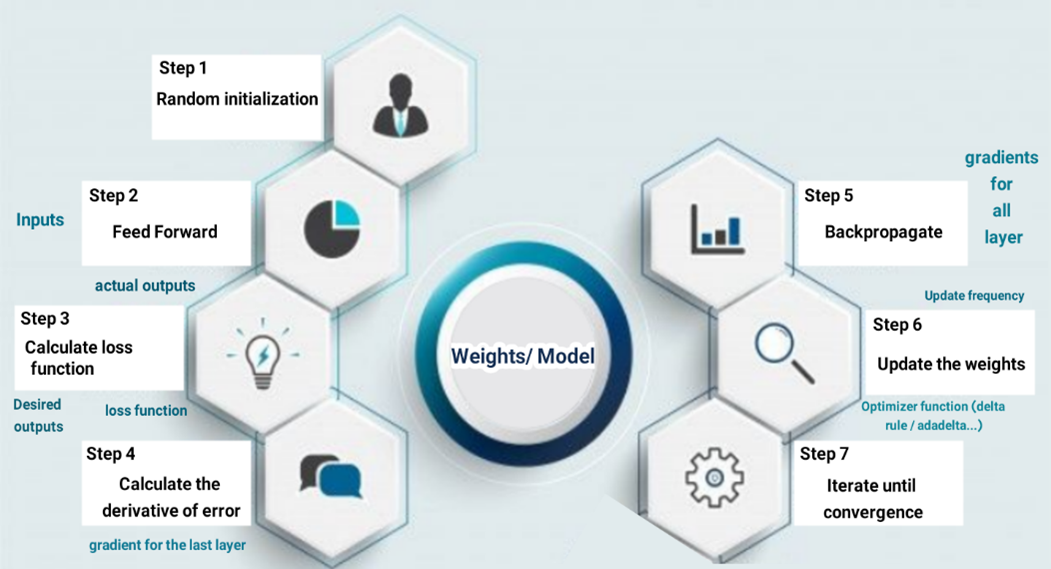
AI: A form of computer intelligence created by humans to perform special and even superhuman tasks easily, and this intelligence is in a constant state of self-improvement. Of course, according to the first author's perspective, this advancement may have limitations, perhaps exceeding even those associated with nuclear weapons. AI has present and future applications, such as indoor-outdoor securities, graphic signal processing, robotic surgery, image processing, character recognition, augmented reality, object detection and tracking, intelligent traffic monitoring, emergency department medical imaging, and many more (Sharma & Garg, 2021). These processes were developed based on decisions and considering choices and reactions of the human brain. As stated, AI based on human neural networks was designed in a way that it can estimate decision-making processes for any type of spatial participation activity simulating a neural network. Brain activities that can always be edited in this new spatial system as seen in Figure 4, the steps used in this paper are shown in Figure 5.
In fact, AI offers comprehensive coverage of most essential topics, including: rise of the machines and communicatios to IoT (3G, 5G). Tools and technologies of AI.
Real-time applications of artificial intelligence using machine learning (ML) and deep learning. challenging issues and novel solutions for realistic applications mining and tracking of motion-based object data image processing and analysis into the unified framework to understand both IoT and AI-based applications (Sharma & Garg, 2021; Aqib et al., 2022).
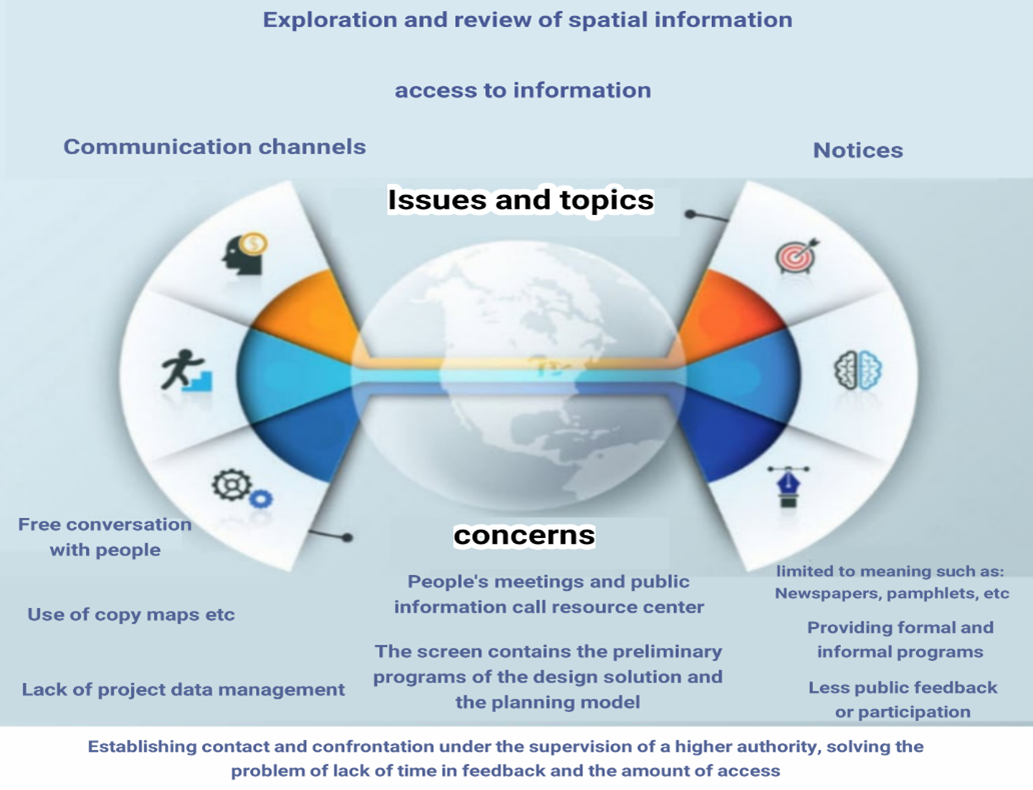
These processes, which encompass psychological factors, are deemed suitable based on observations, questions and answers, past experiences and contextual elements associated with participation. This approach includes the issues and challenges present in current methods of public participation within the planning and urban development processes It simultaneously addresses the time constraints faced by higher-ranking officials, coinciding with the advent of the web. This approach is indicative of human mindset, demonstrating the extent of feedback and the scale of access. The lack of time here is considered a fundamental problem and limitation that the human mind tries to overcome with time management, stress reduction, etc. and also with the accesses established with the human mind or by making contact as represented in Figure 6. For example, in Europe and North America, according to local government and municipality laws, it is necessary to incorporate a certain level of public participation in decision-making processes. The estimates show that, public participation relies on information, a public solution and its effective feedback through public meetings, which is still one of the most specific forms of public participation (Larrain & McCall, 2018;Goreis & Voracek, 2019;Lewenstein, 2022).
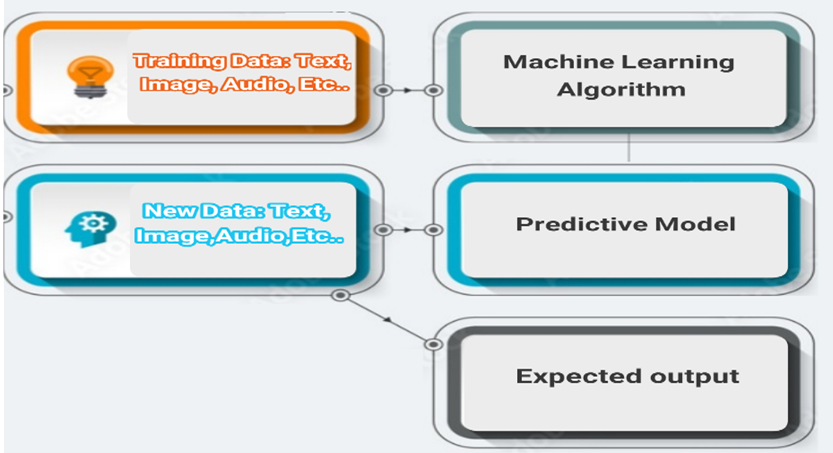
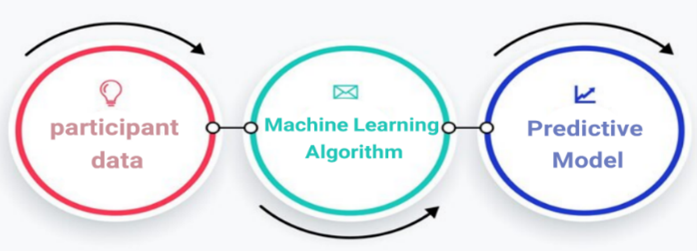
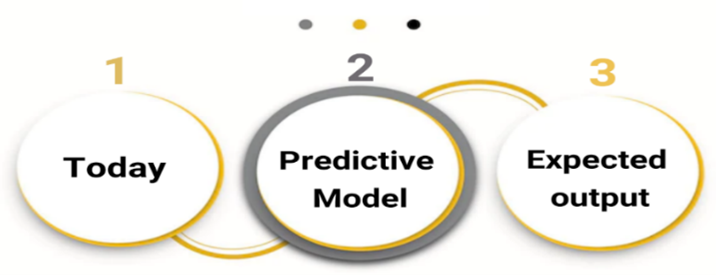
In the realm of AI, when dealing with many variables for problem-solving, a multitude of scenarios can arise. Human limitations in memory and processing capacity make direct programming nearly impossible. In such cases, AI and ML are employed. The computer learns concepts from historical data and is capable of analyzing and making predictions about the future. Teaching a computer a concept, such as participation, does not entail individuals of varying ages, genders, or perspectives engaging in dialogue and expressing opinions on diverse topics while reminiscing about the past. If this was the case, no human would seek dialogue and participation in various matters, and there would never be any participation, and mankind would talk alone until their generation became extinct. Therefore, there would be no relationship and no marriage. In reality, computers are far less knowledgeable than we might assume, and we can only communicate with them using binary language, composed of zeros and ones. The intelligence exhibited by machines in different contexts is referred to as artificial intelligence. In the context of NPGIS, the Python programming language was used, which is a high-level language closely resembling human language. Various algorithms within the field of AI support ML. Figure 7 illustrates the shared steps among ML methods for problem-solving. As depicted in Figure 8, the initial step involves providing historical data (commonly known as training data) to the ML algorithm. Once the algorithm has learned participation patterns from this data and completed its training, it yields a predictive model. Subsequently, inputting the characteristics of today's participants into the trained model, as shown in the third stage, allows the model to provide insights into tomorrow's events. If participation is anticipated, it outputs (1); if no collaborative activity is foreseen, it outputs (0), as depicted in Figure 9.
Methods
The ANP (Network analysis process) is one of the multi-criteria decision-making methods where the criteria, sub-criteria or options (persons and variables) have a dependency or relationship. The hierarchical method or AHP (Analytic Hierarchy Process) can be a special case of the network technique. If there is a problem where the criteria have a relationship with each other or the sub-criteria have internal relationships, this cannot be represented by AHP because the problem will leave the hierarchical state and create a network state. In this case, the problem should be solved through the ANP method. The process of network analysis is a comprehensive and powerful method for making accurate decisions using empirical information or personal judgments available to each decision maker by providing a structure for organizing different criteria and evaluating the importance and preference of each of them over alternatives. This method can be implemented by software. Network analysis is implemented using Super Decisions software and is applied decisions including marketing, medical, political, urban, military, social, and forecasting among many others. The ANP method and its application in various fields is well documented in the operational research literature. This method is included in the compensatory methods (compensatory methods are techniques where the weakness of an option in a certain criterion is compensated by the strength of another criterion). For example, suppose you intend to buy a house, the price of the house may be high, but the location of the house should be good, so the location index somehow compensates the cost index. Also, the indicators are independent or dependent on each other, which are two important features of this desirable model (Saaty, 1990; Saaty, 2004;Bayazit, 2006). To apply and execute the ANP method effectively, the following steps need to be sequentially implemented. This ensures the correct formation of the implementation, in conjunction with the utilization of questionnaires and other software, and seamless integration with GIS software:
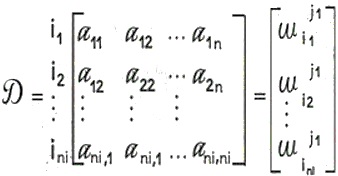
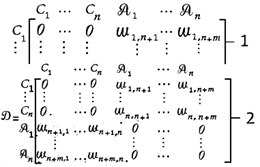
1) Creating a research network diagram: In this step, the problem should be divided into criterion levels, sub-criteria and options. Any relationships between them should be determined. A very important issue in this step is the specification of the existence of relationships between standards that can be specified in several ways. For instance, you can find out these relationships by asking experts. Suppose a system consists of N clusters or N components, and the elements in each cluster affect all or some of the other cluster elements. Of course, this effectiveness should be examined according to the special feature that controls the interactions of the entire system (control criteria). Three types of clusters can be determined as shown in matrix (1): source, destination, and intermediary cluster. C1 represents the source cluster, C5 represents the destination cluster, and C2, C3, C4 are intermediate clusters. C2, C4 have loops that connect them to themselves. These rings represent internal dependency and other connections (edges) represent external dependency.
2) Forming the matrix of paired comparisons: In this step, the elements of each level are compared to other related elements at a higher level in a pairwise manner and matrices of paired comparisons are formed. Also, at the end, a pairwise comparison of internal relationships should be made. These paired comparisons should be answered by Saaty's spectrum of 9 (Saaty, 1990; Saaty, 2004) which can be seen in matrix (1)to (3). Of course, first the matrices should be explained to the resident as an example. Imagine that the problem has N clusters named C1, C2, ... CN and there are Ni elements in the i-th cluster. Now if two clusters i and j are selected and all the elements of i are paired with respect to the first element j measured; The pair matrix (1) shown below is obtained. This matrix is a pairwise comparison of all the elements of branch i with respect to the first element of branch j.
3) Calculating the inconsistency rate: In this step, we calculate the ANP inconsistency rate. If this rate is less than 0.1, it indicates the consistency of the matrix (1).
 (1)
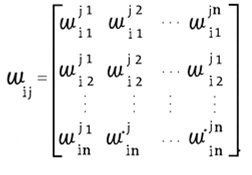
(1)4) Forming the initial super matrix: Using the weight of the obtained pairwise comparisons, we form the initial super matrix. The primary supermatrix is the same weights obtained in step 2 from pairwise comparisons, wij represents the original eigenvector of the influence of criteria in cluster j compared to cluster i. If cluster i has no influence on cluster j, then wij=0 which can be seen in (2).
 (2)
(2)5) Creation of balanced supermatrix: After creating the initial supermatrix, the balanced supermatrix should be created. 6) Creating the limit supermatrix: The balanced supermatrix should be raised to the infinite power so that each row of it converges to a number. That number is the weight of that criterion or subcriterion or option as shown in (3).
 (3)
(3)Statistical analysis was performed on user performance data, which was collected from pre-post web activity questionnaires and analytical software.
Finally,the statistical analysis was performed using the Statistical Package for Social Sciences (SPSS). The following are the activities of statistical authorities that have been used in the study and have made efforts in their studies (Choi, Abel, Siqi-Liu & Umanath, 2021; Tabatabai, Zarei, Kamran & Ahmadi, 2022). Following the descriptions, during the stage of public questioning, a sample size corresponding to the population of Sari was determined, with a minimum sample size of 384 individuals. This test, known as the Friedman test, has been in use since Milton Friedman first examined it in 1937. Notably, this test doesn't require knowledge of the distribution of variable values (Friedman, 1959; Friedmann, 1988; Friedman, Hastie & Tibshirani, 2010), as illustrated in the equations (4)to(6).
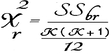 (4)
(4)Equation (4) presents the calculation of the Friedman statistic, represented by χr^2. SSbr is the sum of the rank squares between the distributions and k is the number of categories or distributions for which the ranking is done.
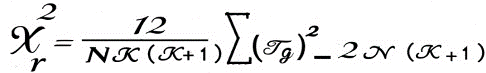 (5)
(5)where N is the number of subjects, k is the number of categories or distributions about which the ranking is done, and Tg is the sum of the ranks of the g-th group.
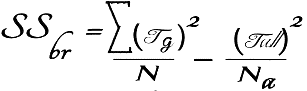 (6)
(6)where N is the total number of ranks of all groups and Tall is the total number of ranks assigned to the subjects. The difference with the previous equation is in the sample size. It means the number of members of the society who are present in the sample.
The statistical value of this test is compared with the critical value obtained from the chi-square distribution table with k-1 degrees of freedom and at the desired confidence level, which is usually 95%. If χr ^2 is greater than the critical value of the table, the null hypothesis is not confirmed. If the result is greater than 0.05, it does not create a significant difference between the groups (Krejcie & Morgan, 1970; Cochran, 1977).
Results
Weighting based on the opinions of experts and stakeholders with the network analysis process
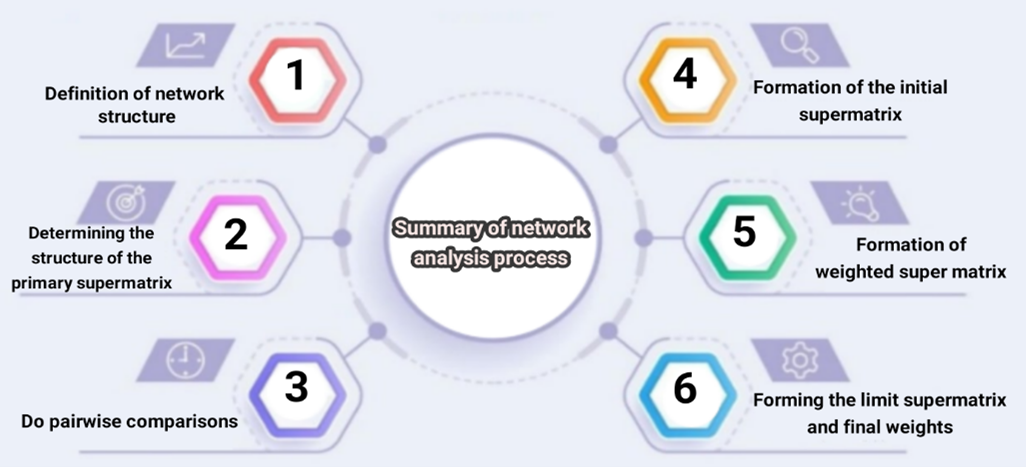
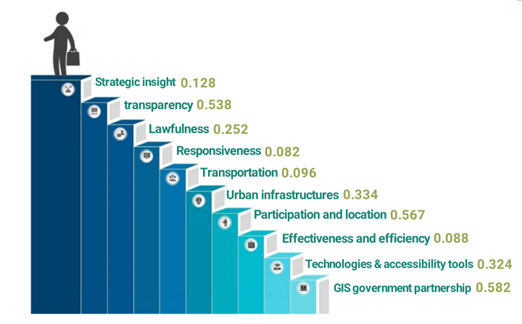
The final weight of the sub-criteria was calculated by multiplying the weight of each criterion by the weight of its corresponding sub-criteria. The results indicate that government cooperative GIS ranked first with a weight of 0.3412. Access technologies and tools ranked in second place with 0.1881, while transparency presented a weight of 0.1681. This highlights the significance of the economic criterion in any process and demonstrates how aligning it with social factors can significantly enhance expected outcomes. Figure 10 provides a summary of the network analysis process and the associated activities.
Nevertheless, when these matters are entrusted to powerful individuals, beneficiaries, or politicians at a level higher than the public, it amplifies the efficacy of goal attainment in this process, as illustrated in Table 1. The criteria were selected in three groups: social, socio-economic, and economic social groups. The selections were made in such a way that were consistent with the statistical ranking of the public, with Super decision 9.24 software as shown in Figure 11.
| Criterion | CW | Sub-criterion | SCrel_w | SCfin_w | R |
| Social | 0.303 | Strategic insight | 0.128 | 0.0359 | 8 |
| transparency | 0.538 | 0.1681 | 3 | ||
| Lawfulness | 0.252 | 0.0792 | 4 | ||
| Responsiveness | 0.082 | 0.0258 | 9 | ||
| Socio-Economic | 0.155 | Transportation | 0.096 | 0.0109 | 10 |
| Urban infrastructures | 0.334 | 0.0367 | 7 | ||
| Participation and location | 0.567 | 0.0619 | 5 | ||
| Economic - Social | 0.542 | Effectiveness and efficiency | 0.088 | 0.0519 | 6 |
| Technologies & accessibility tools | 0.324 | 0.1884 | 2 | ||
| GIS government partnership | 0.582 | 0.3412 | 1 |
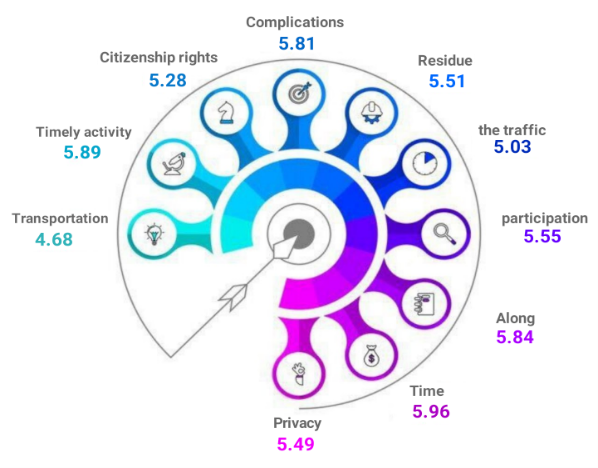
Statistical ranking of selected criteria with the priority of the public
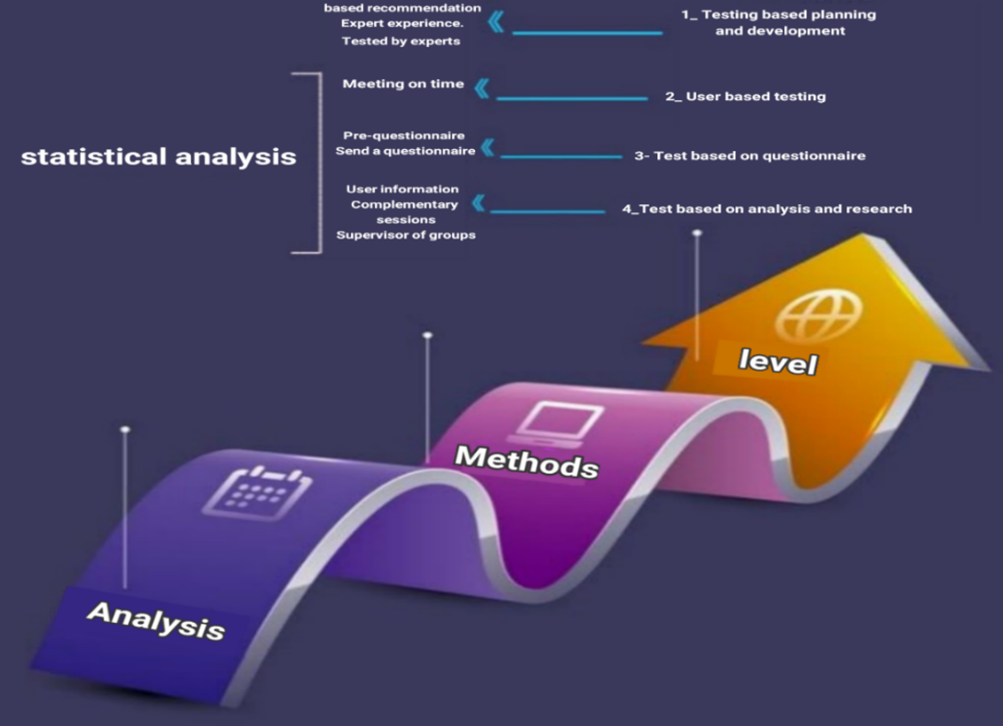
Analytical, superficial, and statistical methods as well as software usability are shown in Figure 12. In addition, it shows the sequence of steps taken during the usability evaluation for an NPGIS prototype, used to measure the success or failure of the prototype based on the selected evaluation criteria. In this section, the ranking results of criteria based on Friedman's test are shown. The selection of criteria was based on previous experiences and studies as well as individual creativity of the researcher. Citizenship rights, Complications, Residue, F Transportation, Timely activity, traffic, participation, Cell phone, Time. The results of this test showed that the proposed factors had a significant difference at the 99% confidence level. The comparison of the average ratings showed that the time with an average of 5.96 is in the first place and the activity on time is in the second place with an average of 5.89 and the mobile option which is the same as the mobile smartphone and the result of the first and second options with a score of 5.84 is in the third place and other factors were ranked next.
The rating was done by computer software and results are presented in Table 2. The weighting was calculated with SPSS 22.0 statistical software. Figure 13 presents the statistical process diagram.
| Dimensions | AR | R | K2 | df | Sig | |
| Transportation | C1 | 4.68 | 10 | 47.749 | 9 | 0.001 |
| Timely activity | C2 | 5.89 | 2 | |||
| Citizenship rights | C3 | 5.28 | 8 | |||
| Complications | C4 | 5.81 | 4 | |||
| Residue | C5 | 5.51 | 6 | |||
| Traffic | C6 | 5.03 | 9 | |||
| Participation | C7 | 5.55 | 5 | |||
| Cell phone | C8 | 5.84 | 3 | |||
| Time | C9 | 5.96 | 1 | |||
| Privacy | C10 | 5.49 | 7 |
Programming and creating open-source software
As mentioned in the preceding sections, the emphasis on developing software with the assistance of AI, along with the incorporation of statistical questionnaires, as well as concurrent network and hierarchical analysis, are among the noteworthy innovations of this study. I and the utilization of neural network machines, along with the crucial role of time, hold significant significance in this context. Python language has been used for programming as shown on Figure 14. This diagram illustrates one of the stages involved in creating NPGIS software, chosen for presentation based on discretion. The main importance of the information related to the user's knowledge and work experience with webGIS programs, collaborative planning, education and general web surfing. This information makes it possible to interpret the corresponding responses and reactions from different participants and helps to determine the limits on the complexity of the prototype program (Brunsdon & Comber, 2020;Arribas-Bel, Green, Rowe, & Singleton, 2021). The past decade has witnessed a surge in computational intelligence for addressing problems that lack a clear-cut solution or are challenging to resolve. The biological neural network in humans inspires artificial neural networks (ANNs), and research on neural networks has been closely associated with comprehending the structure and learning function of the human brain. The accessibility of this environment, which incorporates open-source software, is determined by the discretion of its creator, making it available to the general public and all age groups. However, this accessibility is subject to the terms and conditions applicable in each region or locality, demonstrating its adaptable nature. (Fallah et al., 2022a; Fallah et al., 2022b).
Advancement in the understanding of participation within the sequential stages of this study.
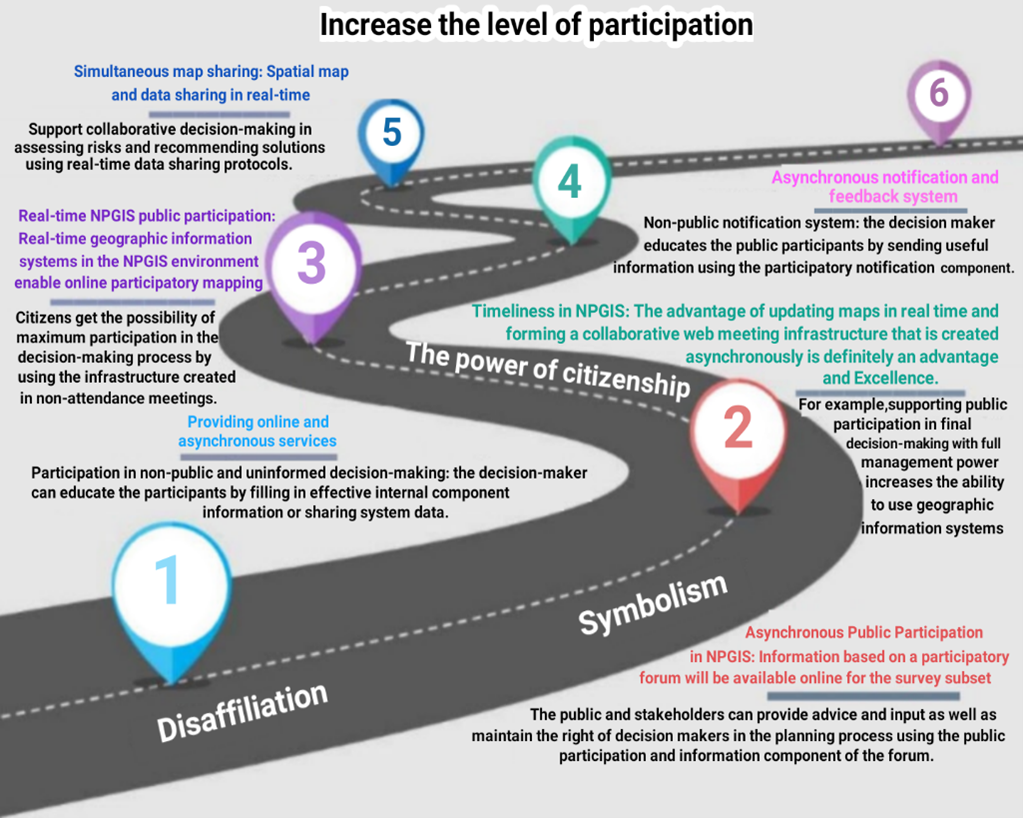
Through an examination of related fields in collective participation communication, it became evident that there exists a connection between a shared group of geographic information system prototypes and the degree of public participation. This connection illustrates the exchange of information across various levels of participation, encompassing both active citizens and non-participants, as well as interactions between the general public and decision-makers. In this paper, the connection between the level of participation and the suggested information system was explored. It was also observed that this approach had the potential for expansion post-implementation, a need that had been overlooked for various reasons. Each level of public participation is directly linked to one or more components of NPGIS, namely notification, GIS-based discussion forum, real-time map sharing, and virtual meeting environment. Figure 15 shows the role of participation proposals and the increasing the level of participation at the local, national and transnational levels. This form has been proposed considering the spatial and temporal conditions of real-time.
The significance of real-time or synchronous responses.
It should be emphasized that when considering criteria for decision-making participation in urban planning in this study, there are numerous criteria to contend with. Consequently, the time factor has taken center stage. It's essential to remember that one cannot oppose technology and advancement.
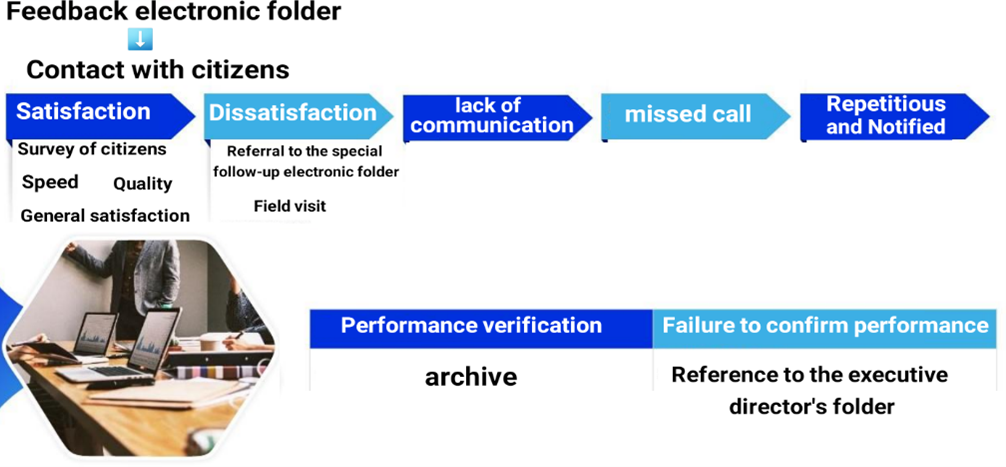
Furthermore, all criteria and subjects share a common factor, which is time. However, the significant challenge that experts are encountering in 2022 is that everyone has access to vast information through tools like Google and YouTube, and in the end, they do not become experts in any subject they remain observers of general knowledge. Programs should be designed to enable real-time communication so that users can use topics aligned with real-world objects for geographic reference. Real-time conversation integration provides a powerful and flexible way to manage spatially referenced topics. Figure 16 presents an example of the incorrect cycle for establishing public contact with the municipal body, ultimately resulting in neglect. The reason is the response of the operators or officials which sometimes involves delays or even ignoring the matter. Factors contributing to this include traffic, being far from the location of the report, lack of facilities, and similar issues. The importance of studying in this section becomes evident, although other reasons have been mentioned in the previous sections. Therefore, responding promptly or synchronously or real-time regardless of the label used is not only crucial, but also imperative in some instances.
Participation
The value proposition of a great city extends beyond job creation, it involves providing opportunities for all city residents to mitigate inequality and safeguard against harm. Equal opportunities should be available to everyone. When a problem is solved in a short period of time, it benefits the whole city and everyone does the right thing based on the time required, and like dominoes, the problems are solved. Based on the recommendations made by the general public and stakeholders, specific locations at the city level were identified as potentially highly suitable for medical activities and services (see Figure 16). Figure 17 presents a collaborative map, Figure 17 a) shows the constructions done so far, 17 b) the zoning in terms of city locations, 17 c) the asphalted and audited roads, 17 d) the transportation status, 17 e) the selected places that seem inappropriate, Figure 17 f) presents a map that mapping professionals will use, 17 g) the areas identified as historical and Figure 17 h) public participation with stakeholder participation.
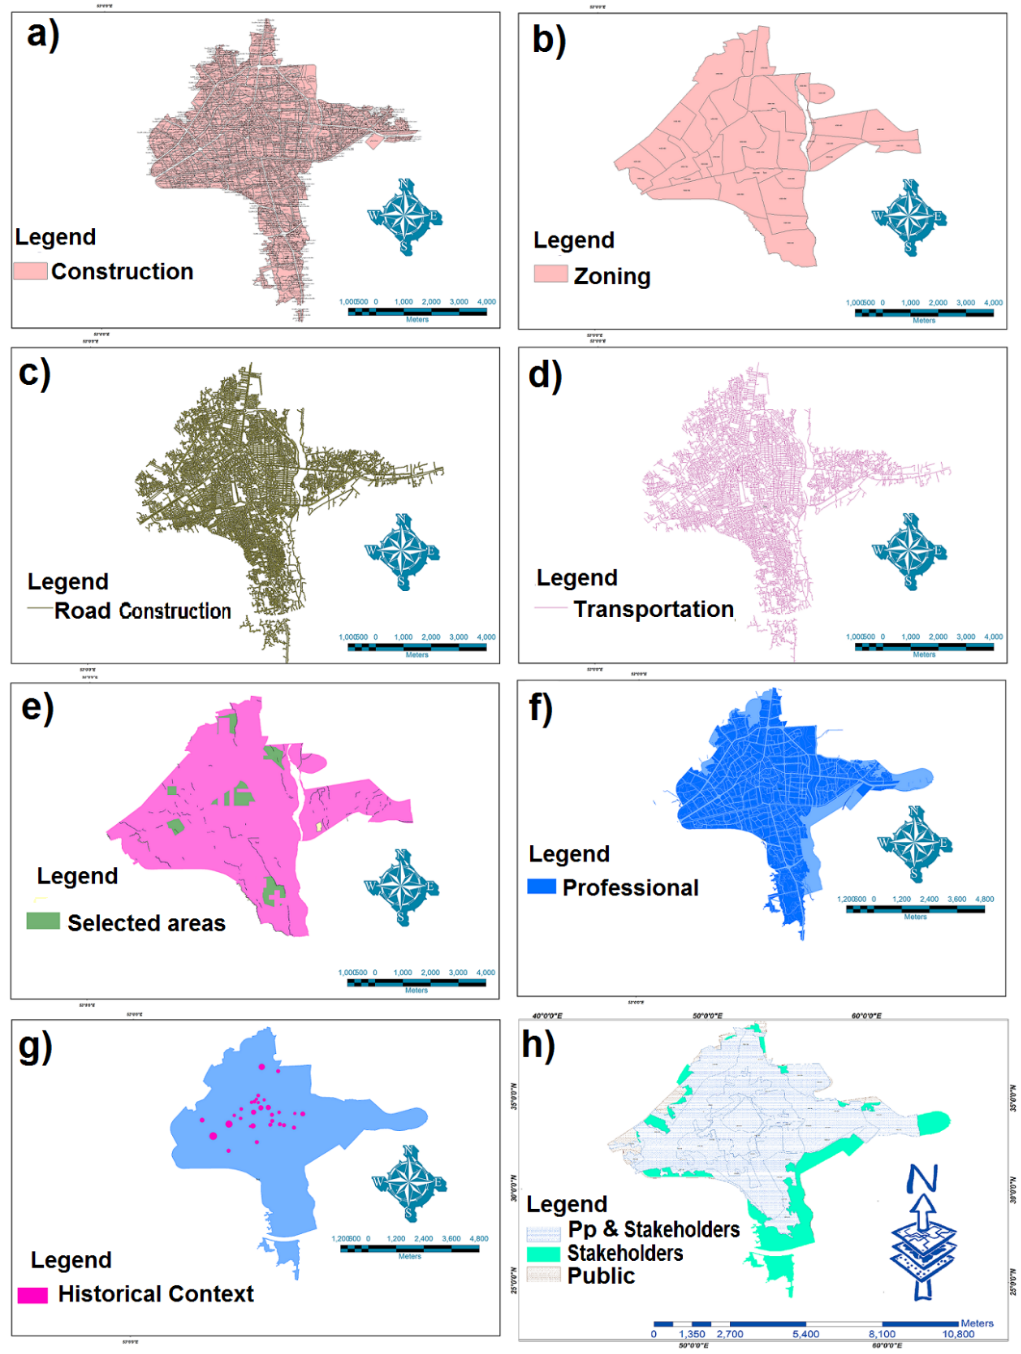
As seen in Figure 17, participation is feasible in any field and location activity, especially when spatio-temporal software along with its environment offers an accessible platform available to the public. The abundance of responses, even with a small number of participants, indicates an easy-to-use interface. This means that even the hands of those who do not have mass planning experience in routing will be able to create a new network of routes with confidence and without any doubts. Therefore, in addition to effective decision-making, the paths that are created in a place will be clear and realistic. In this usability section, the participants were asked to identify concerns related to planning and participation in the development of Sari city. This is the subject of investigation and how to respond to the moment and simultaneity created in this scenario. Evaluating the usability of the GIS map sharing system as a supportive tool for urban planning participation, is the subject of this fictitious example, which can be a justified and optimal basis for participation. For this purpose, a person experienced in this field was involved. Fifteen municipal employees were chosen to share the map and introduce it in an interactive work environment. The behavior and responses of each participant were closely observed and recorded using a computer and creating a questionnaire. The aim of this paper assesses the usability of the prototype through the presentation of a hypothetical case study involving Sari Municipality´s planning and development with the framework of the public accountability system. It was assumed that regional reform plans, allowed for potential reforms in any various areas and regions. Spatial data related with these improvements were prepared in the form of GIS files using software, and these filers were uploaded to the computer as a web-based map layer making them accessible as an open and public layer. This highlights the significant importance of real-time participation, as it has the potential to enhance conditions in any sector. Figure 18 shows the final phase of human participation with AI where a) is the first stage of software display, b) the second stage of software display, c) the third stage of software display and d) the software display stage
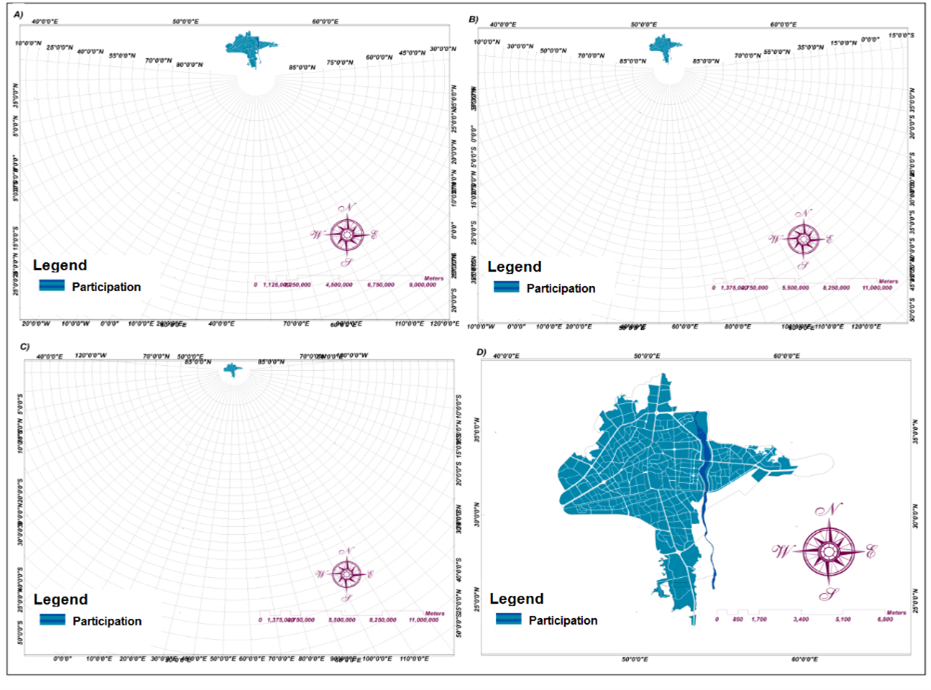
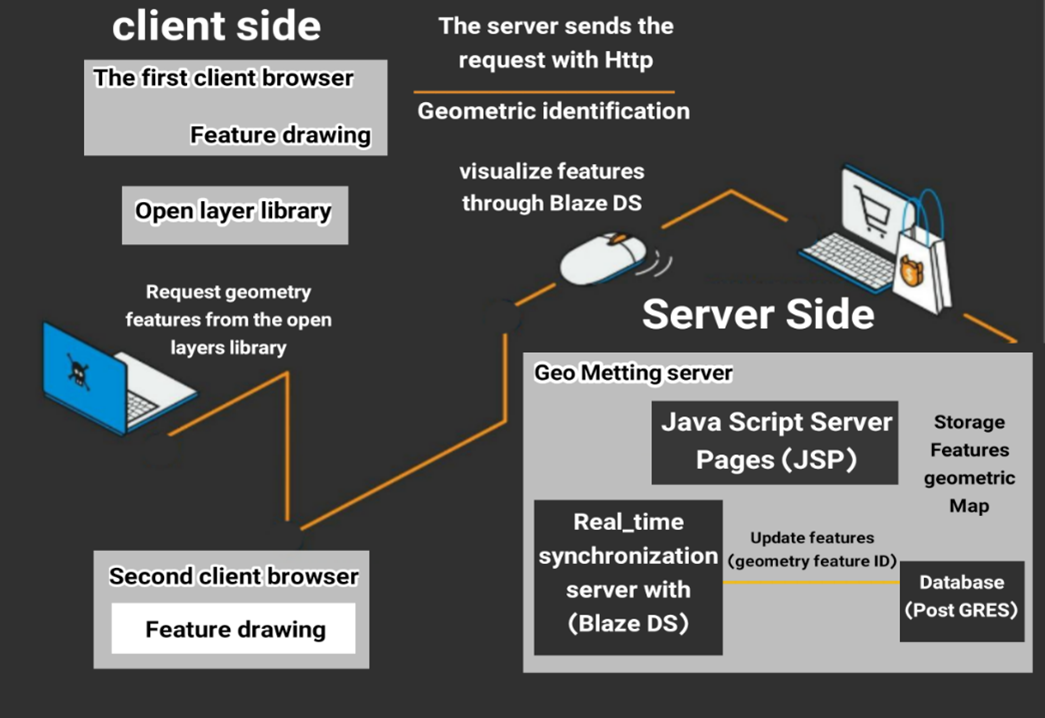
Figure 19 illustrates how the software can display the entire area within its designated zones. This includes features such as emergency assistance, tourist services, postal services, implementing feedback from public and officials, and delivering help promptly. These capabilities represent a groundbreaking advancement in the field of GIS, coding and programming.
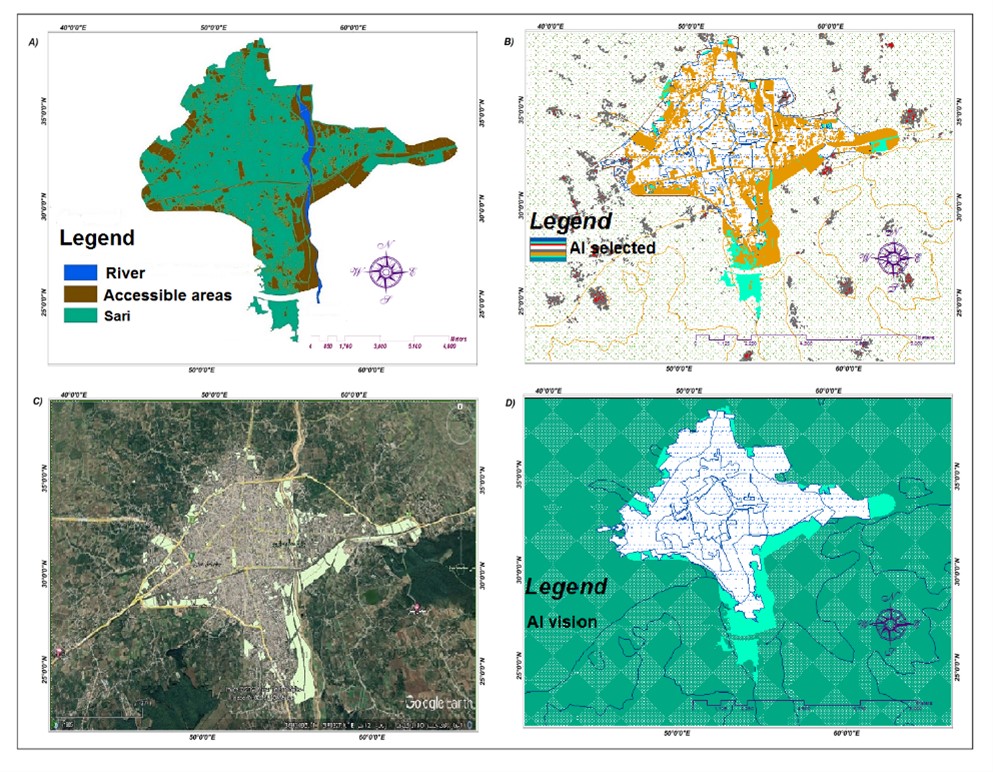
As previously mentioned, providing further details is not possible due to privacy reasons. This area encompasses 36,422,749,000 m2 in UTM zone 39. In Figure 19 a) is the final shape means accesses and demographic areas based on participation. On the other hand, Figure 19 b) is the final selections of artificial intelligence, which has recognized the area around the target as the main criteria. For example, to choose roads and urban settlements or anything that is in the city, AI has done the calculations from 50 km outside the main range. Therefore, it is incapable of understanding human needs and priorities. Figure 19 c) shows the real world on a Google map, while Figure 19 d) shows a virtual view of AI with visible reality. Perhaps this analogy is not correct, but humans don't pay attention to ants' nest to build a road.
Discussion
Most people consider one type of intelligence, i.e., mathematical intelligence, as a sign of being smart and having a healthy brain, but humans have different types of intelligence. For example: spatial intelligence, that is, the brain's ability to solve spatial problems, arrange three-dimensional objects, and understand the patterns of the three-dimensional world around us. This is almost the reason why people with Alzheimer's lose their way home because the part of their brain that is related to spatial intelligence is damaged. Spatial intelligence makes life easier for humans. This study also deals with the same issue in a way, which has a spatial nature. It is important to understand what decisions people make under different circumstances. While artificial intelligence makes logical and predictable decisions in any situation.
Concerning questions stated in this paper responding if. geographical sciences interact with the public health of a region, geographical science is definitely one of the main components showing the health of a region. Because AI/ is the only experience that humans give it and it does not have the ability to experience on its own. An architect deals with constructions in the city, a doctor with medical and health issues and an engineer with technical approaches to solve problems directly. But a geographer and planner is a manager, and to control a city, he gathers a group of doctors and engineers and different ranges of people together and is responsible for guiding them. Therefore, the first hypothesis is confirmed. In response to the second question if it is conceivable that artificial intelligence (AI) may eventually replace medical sciences in the forthcoming decades, it should be said that artificial intelligence will not be able to examine the mental and psychological factors of people in very different conditions and providing a different version of it, in the way that doctors can do. Therefore, a healthy city is where skilled doctors are working and in the selection of places and accesses, AI has chosen places that are not needed, even outside the scope of the study, and makes decision-making a challenge. From the point of view of artificial intelligence, the accident of a car with a pedestrian and the accident of a car with a truck are both identified as accidents. In fact, the second hypothesis is rejected. Regarding the third question about what the determining criterion in collaborative decision-making is, the hypothesis raised in this research should be confirmed, because it is precisely this factor of time that strongly affects people's decisions, behavior and responses. In other words, decision makers do not know what is going on in people's minds when they answer the questions. The mind of a tourist considers the beauty of an area and then the time to reach the desired place. Then the employee who thinks how he will get to the desired place every day and then answers the questions related to the time, or a hospital that exists near the same place and a person should be taken there. Although all three views are different from each other, the criteria related to time are more important and have gained more points. This study is prepared for tourism sciences, medicine, engineering, and spatial planning in a geographical environment. It should always be kept in mind that participation requires collective intelligence.
Conclusions
Geospatial health has a special role in the process of urban development, and until people do not benefit from mental health and are constantly involved in daily events, they will make objective mistakes in decisions. For these reasons, public health is intertwined with urban science. The results of this collaborative study have consciously interwoven all remote sensing sciences and pure GIS science in a completely specialized way. Of course, this was the topic that the researcher reached in the middle of the road. Because the main activity of this research was to introduce new research using space-time-place and to develop a software related to these features, the details of the study were not mentioned for different reasons, including the protection of personal works and privacy. which is considered natural. As mentioned in the previous sections, these days the desire to use AI has increased greatly. Because the authors think sometimes it is not clear what they are dealing with . Doing any activity in a faster time makes people happy. But at what price? The loss of human relationships, workforce adjustments and people's disillusionment, reduced human emotions and overreliance on logic and machine intelligence, which can sometimes lead to erroneous outcomes and may make people sacrifice their rational decisions. Can artificial intelligence take responsibility for these? AI is a subject that is widely used and developed by humans. In this study, for the first time, a combination of statistical analysis and ranking methods were employed, leading to a comprehensive summary. The desired accesses and locations were identified. Then it was found that the criteria related to time have maximum priority for different people. People with different mental and emotional conditions do not have the same answers to questions, which was observed both in the ranking of criteria and in the statistical sampling method. AI always provides the fastest solution because it is designed and programmed by humans. But it cannot consider human emotions and feelings. All the mentioned steps were designed and executed together in the NPGIS software environment. The participation of people in a stress-free environment has a much greater impact on decisions, especially spatial decisions. The results of this study show the influence of geographers in spatial planning and its management. AI is useful as long as it can be developed under human control.
References
Aeon, B., Faber, A., & Panaccio, A. (2021). Does time management work? A meta-analysis. PLOS ONE, 16(1), e0245066. https://doi.org/10.1371/journal.pone.0245066
Anderson, M., & Radil, S. M. (2019). A hard binary to shake: The limitations and possibilities of teaching GIS critically. Canadian Geographer, 64(4), 471–483. https://doi.org/10.1111/cag.12526
Anderson, M., & Sternberg, C. (2012). “Non-White” gentrification in Chicago’s Bronzeville and Pilsen. Urban Affairs Review, 49(3), 435–467. https://doi.org/10.1177/1078087412465590
Aqib, M., Kumar, D., & Tripathi, S. (2022). Machine Learning for Fog Computing: Review, Opportunities and a Fog Application Classifier and Scheduler. Wireless Personal Communications. https://doi.org/10.1007/s11277-022-10160-y
Arribas-Bel, D., Green, M. A., Rowe, F., & Singleton, A. (2021). Open data products-A framework for creating valuable analysis ready data. Journal of Geographical Systems, 23(4), 497–514. https://doi.org/10.1007/s10109-021-00363-5
Badwi, I. M., Ellaithy, H. M., & Youssef, H. E. (2022). 3D-GIS parametric modelling for virtual urban simulation using CityEngine. Annals of GIS, 28(3), 325–341. https://doi.org/10.1080/19475683.2022.2037019
Baron, S., Miller, K., & Tallant, J. (2022). Out of time. In Oxford University Press eBooks. https://doi.org/10.1093/oso/9780192864888.001.0001
Bayazit, O. (2006). Use of analytic network process in vendor selection decisions. Benchmarking: An International Journal, 13(5), 566–579. https://doi.org/10.1108/14635770610690410
Brown, G. (2016b). A review of sampling effects and response bias in Internet Participatory Mapping (PPGIS/PGIS/VGI). Transactions in Gis, 21(1), 39–56. https://doi.org/10.1111/tgis.12207
Brunsdon, C., & Comber, A. (2020). Opening practice: supporting reproducibility and critical spatial data science. Journal of Geographical Systems, 23(4), 477–496. https://doi.org/10.1007/s10109-020-00334-2
Builes, D. (2021). Look at the time! Analysis. https://doi.org/10.1093/analys/anab008
Cochran W G., (1977). Sampling Technique. third Edition, John Wiley and Sons Inc., New York, 442 Pages, https://archive.org/download/ Cochran1977SamplingTechniques _201703 / Cochran_ 1977_ Sampling %20Techniques.pdf
Choi, S. Y., Abel, M., Siqi-Liu, A., & Umanath, S. (2021). National identity can be comprised of more than pride: Evidence from collective memories of Americans and Germans. Journal of Applied Research in Memory and Cognition, 10(1), 117–130. https://doi.org/10.1016/j.jarmac.2020.09.004
Dunn, C. E. (2007). Participatory GIS — a people’s GIS? Progress in Human Geography, 31(5), 616–637. https://doi.org/10.1177/0309132507081493
Fagerholm, N., García-Martín, M., Torralba, M., Bieling, C., & Plieninger, T. (2022). Public participation geographical information systems (PPGIS): Participatory research methods for sustainability ‐ toolkit #1. Gaia (Heidelberg), 31(1), 46–48. https://doi.org/10.14512/gaia.31.1.10
Fallah, M., (2022) August 23, Doctoral dissertation under the supervision of Dr. Tajoddin Karmi, Assistant Professor of Faculty of Geographical Sciences and Department of Urban Planning, Kharazmi University.
Fallah, M., Karami, T., & Kojouri, M. K. (2022a). National participant geospatial information system in urban planning. ВісникХарківського Національного Університету Імені В.Н. Каразіна, 27, 32–50. https://doi.org/10.26565/1992-4259-2022-27-03
Fallah, M., Karami, T., & Kojouri, M. K. (2022b). Explaining the Role of National Participant Geospatial Information System in the Effectiveness of Urban Services with a New Approach. Jurnal Geografi, 15(1), 32. https://doi.org/10.24114/jg.v15i1.38992
Friedman, J. H., Hastie, T., & Tibshirani, R. (2010). Regularization paths for generalized linear models via coordinate descent. Journal of Statistical Software, 33(1). https://doi.org/10.18637/jss.v033.i01
Friedman, M. (1959). The demand for money: Some theoretical and empirical results. Journal of Political Economy, 67(4), 327–351. https://doi.org/10.1086/258194
Friedmann, J. (1988). Planning in the public domain. https://doi.org/10.1515/9780691214009
Ghose, R. (2017). Public-Participation GIS. International Encyclopedia of Geography: People, the Earth, Environment and Technology, 1–11. https://doi.org/10.1002/9781118786352.wbieg1155
Goreis, A., & Voracek, M. (2019). A Systematic Review and Meta-Analysis of Psychological Research on Conspiracy Beliefs: field characteristics, measurement instruments, and associations with Personality traits. Frontiers in Psychology, 10. https://doi.org/10.3389/fpsyg.2019.00205
Greene, T. J. (2022). Disinformation: the nature of facts and lies in the post-truth era. Public Services Quarterly, 18(4), 301–302. https://doi.org/10.1080/15228959.2022.2121136
Haiti Projects., (2019), Empowering Women and their families in Rural Haiti., https:// www. Haitiprojects .org/ what-is-haiti-projects
Haiti Situation Report, (2019), UN Office for the Coordination of Humanitarian Affairs, UN Office for the Coordination of Humanitarian Affairs., To learn more about OCHA's activities, https://www.unocha.org, FTS https://fts.unocha.org/appeals/679/summary
Indrajit, A., Van Loenen, B., & Van Oosterom, P. (2019). Assessing spatial information themes in the spatial Information Infrastructure for Participatory Urban Planning Monitoring: Indonesian Cities. ISPRS International Journal of Geo-information, 8(7), 305. https://doi.org/10.3390/ijgi8070305
Isfandiyār, M. I. a. I. (1905). An abridged translation of the history of Ṭabaristʹan.
Johnson, M., Adams, V. M., Byrne, J., & Harris, R. M. B. (2022). The benefits of Q + PPGIS for coupled human-natural systems research: A systematic review. AMBIO: A Journal of the Human Environment, 51(8), 1819–1836. https://doi.org/10.1007/s13280-022-01709-z
Krejcie, R. V., & Morgan, D. W. (1970). Determining sample size for research activities. Educational and Psychological Measurement, 30(3), 607–610. https://doi.org/10.1177/001316447003000308
Larrain, A. Á., & McCall, M. K. (2018). Participatory Mapping and Participatory GIS for Historical and Archaeological Landscape Studies: a Critical Review. Journal of Archaeological Method and Theory, 26(2), 643–678. https://doi.org/10.1007/s10816-018-9385-z
Lewenstein, B. V. (2022). Is citizen science a remedy for inequality? Annals of the American Academy of Political and Social Science, 700(1), 183–194. https://doi.org/10.1177/00027162221092697
Malpass, A. (2021). All the time in the world. Mind, 131(523), 788–806. https://doi.org/10.1093/mind/fzaa086
McAllister, J. (2019). Does artistic value pose a special problem for time travel theories? British Journal of Aesthetics, 60(1), 61–69. https://doi.org/10.1093/aesthj/ayz041
Prener, C. (2021). Digitizing and Visualizing Sketch map Data: A Semi-Structured Approach to Qualitative GIS. Cartographica: The International Journal for Geographic Information and Geovisualization, 56(4), 267–283. https://doi.org/10.3138/cart-2020-0030
Radil, S. M., & Anderson, M. (2018). Rethinking PGIS: Participatory or (post)political GIS? Progress in Human Geography, 43(2), 195–213. https://doi.org/10.1177/0309132517750774
Saaty, T. L. (1990). How to make a decision: The analytic hierarchy process. European Journal of Operational Research, 48(1), 9–26. https://doi.org/10.1016/0377-2217(90)90057-i
Saaty, T. L. (2004). Fundamentals of the analytic network process — Dependence and feedback in decision-making with a single network. Journal of Systems Science and Systems Engineering, 13(2), 129–157. https://doi.org/10.1007/s11518-006-0158-y
Sharma, L., & Garg, P. (2021). Artificial intelligence. In Chapman and Hall/CRC eBooks. https://doi.org/10.1201/9781003140351
Silva, C. N. (2013a). Open-source urban governance. In Advances in electronic government, digital divide, and regional development book series (pp. 1–18). https://doi.org/10.4018/978-1-4666-4169-3.ch001
Silva, C. N. (2013b). Open-source urban governance. In Advances in electronic government, digital divide, and regional development book series (pp. 1–18). https://doi.org/10.4018/978-1-4666-4169-3.ch001
Statistical yearbook of Iran, (2018), national portal of statistics "Population of cities of Iran, Statistics Center of Iran, https://www.amar.org.ir/english/Iran-Statistical-Yearbook
Sternberg, C., & Anderson, M. (2014). Contestation and the local trajectories of neoliberal urban governance in Chicago’s Bronzeville and Pilsen. Urban Studies, 51(15), 3198–3214. https://doi.org/10.1177/0042098014532143
Tabatabai, A., Zarei, B., Kamran, D H., Ahmadi, A., (2022), Investigating the process of formation of national identity in Iran, in terms of territorialism., Journal of Geography, Vol.20, No.72, Spring 2022, http://dor.net/dor/20.1001.1.27833739.1401.20.72.2.8
Teixeira, H., Magalhães, A., Ramalho, A., De Fátima Pina, M., & Gonçalves, H. (2021). Indoor Environments and Geographical Information Systems: A Systematic Literature review. SAGE Open, 11(4), 215824402110503. https://doi.org/10.1177/21582440211050379
Usahidi H.P.E, Ushahidi Haiti Project Evaluation, (2011), in: Morrow, A., Mock, N., Papendieck, A., Kocmich, N., (2014), Independent Evaluation of the Ushahidi Haiti Project, some of the authors of this publication are also working on these related projects on 30 October. (2014), consulted in 2022 from:
Valánszki, I., Kristensen, L. S., Jombach, S., Ladányi, M., Kovács, K. F., & Fekete, A. (2022). Assessing Relations between Cultural Ecosystem Services, Physical Landscape Features and Accessibility in Central-Eastern Europe: A PPGIS Empirical Study from Hungary. Sustainability, 14(2), 754. https://doi.org/10.3390/su14020754
Wessels, B. (2010). The role of local agencies in developing community participation in E-Government and E-Public Services. In IGI Global eBooks (pp. 286–305). https://doi.org/10.4018/978-1-61520-929-3.ch015
Zolkafli, A., Liu, Y., & Brown, G. (2017). Bridging the knowledge divide between public and experts using PGIS for land use planning in Malaysia. Applied Geography, 83, 107–117. https://doi.org/10.1016/j.apgeog.2017.03.013
CDMA, Southwest Haiti Earthquake: Situational Report #01, January (2022), https://reliefweb.int/report/haiti/southwest-haiti-earthquake-situational-report-01-january-2022

